概述
本策略的核心思想是利用CCI指标判断市场趋势方向,以及利用EMA指标对CCI进行平滑处理,实现趋势跟随交易。当CCI上穿过买点时做多,当CCI下穿过卖点时做空,达到跟随市场趋势的目的。
策略原理
计算CCI指标。CCI指标以当日收盘价与过去20天的均线的偏离程度来判断目前的股价是否已超买或超卖。公式为:(typical price - 20日SMA) / (0.015 * 20日典型价格标准差)。
对CCI指标进行EMA平滑处理,得到CCI-EMA曲线,以减少CCI指标的震荡,使信号更明确。
设置CCI的买点和卖点。当CCI-EMA上穿过买点时,做多;当CCI-EMA下穿过卖点时,做空。
持仓至CCI-EMA再次触碰买点或卖点时平仓。
策略优势分析
利用CCI判断市场趋势方向,再结合EMA过滤假信号,可以有效跟踪市场趋势。
CCI指标对价格异常敏感,可以快速捕捉趋势的转折。EMA指标能减少误报率。二者配合使用,可以在趋势开始阶段即抓住机会。
采用趋势跟随策略,可最大限度减少交易次数,降低交易成本和滑点损失。
策略回测效果较好,具有一定的实盘可行性。
策略风险分析
CCI指标存在对曲线过度敏感的问题,EMA无法完全滤除所有假信号,仍存在一定的误报风险。
纯趋势跟随策略,在趋势震荡或反转时容易亏损。应适当配合趋势判断指标使用。
纯机械交易策略,无法根据市场情况灵活调整参数,存在过优化风险。
回测数据不足,无法完全反映实盘表现。实盘时应适当调整参数,严格控制止损。
策略优化方向
优化CCI的参数,测试不同长度周期的参数效果。
优化EMA参数,寻找最佳的EMA周期长度。
测试不同的买卖点参数组合,找到最优参数。
结合其他指标判断趋势反转,设置止损位来避免亏损扩大。
添加自动参数优化功能,根据不同品种自动寻找最优参数组合。
总结
本策略整体来说是一个较为简单的趋势跟随交易策略。它利用CCI判断趋势方向且对价格变化敏感,配合EMA进行滤波从而产生交易信号。策略具有一定的优势,但也存在一些风险需要注意。通过参数优化以及配合使用其他指标,可以进一步提高策略稳定性和实盘表现。总体来说,本策略为量化交易提供了一个简单可靠的趋势跟随策略模板。
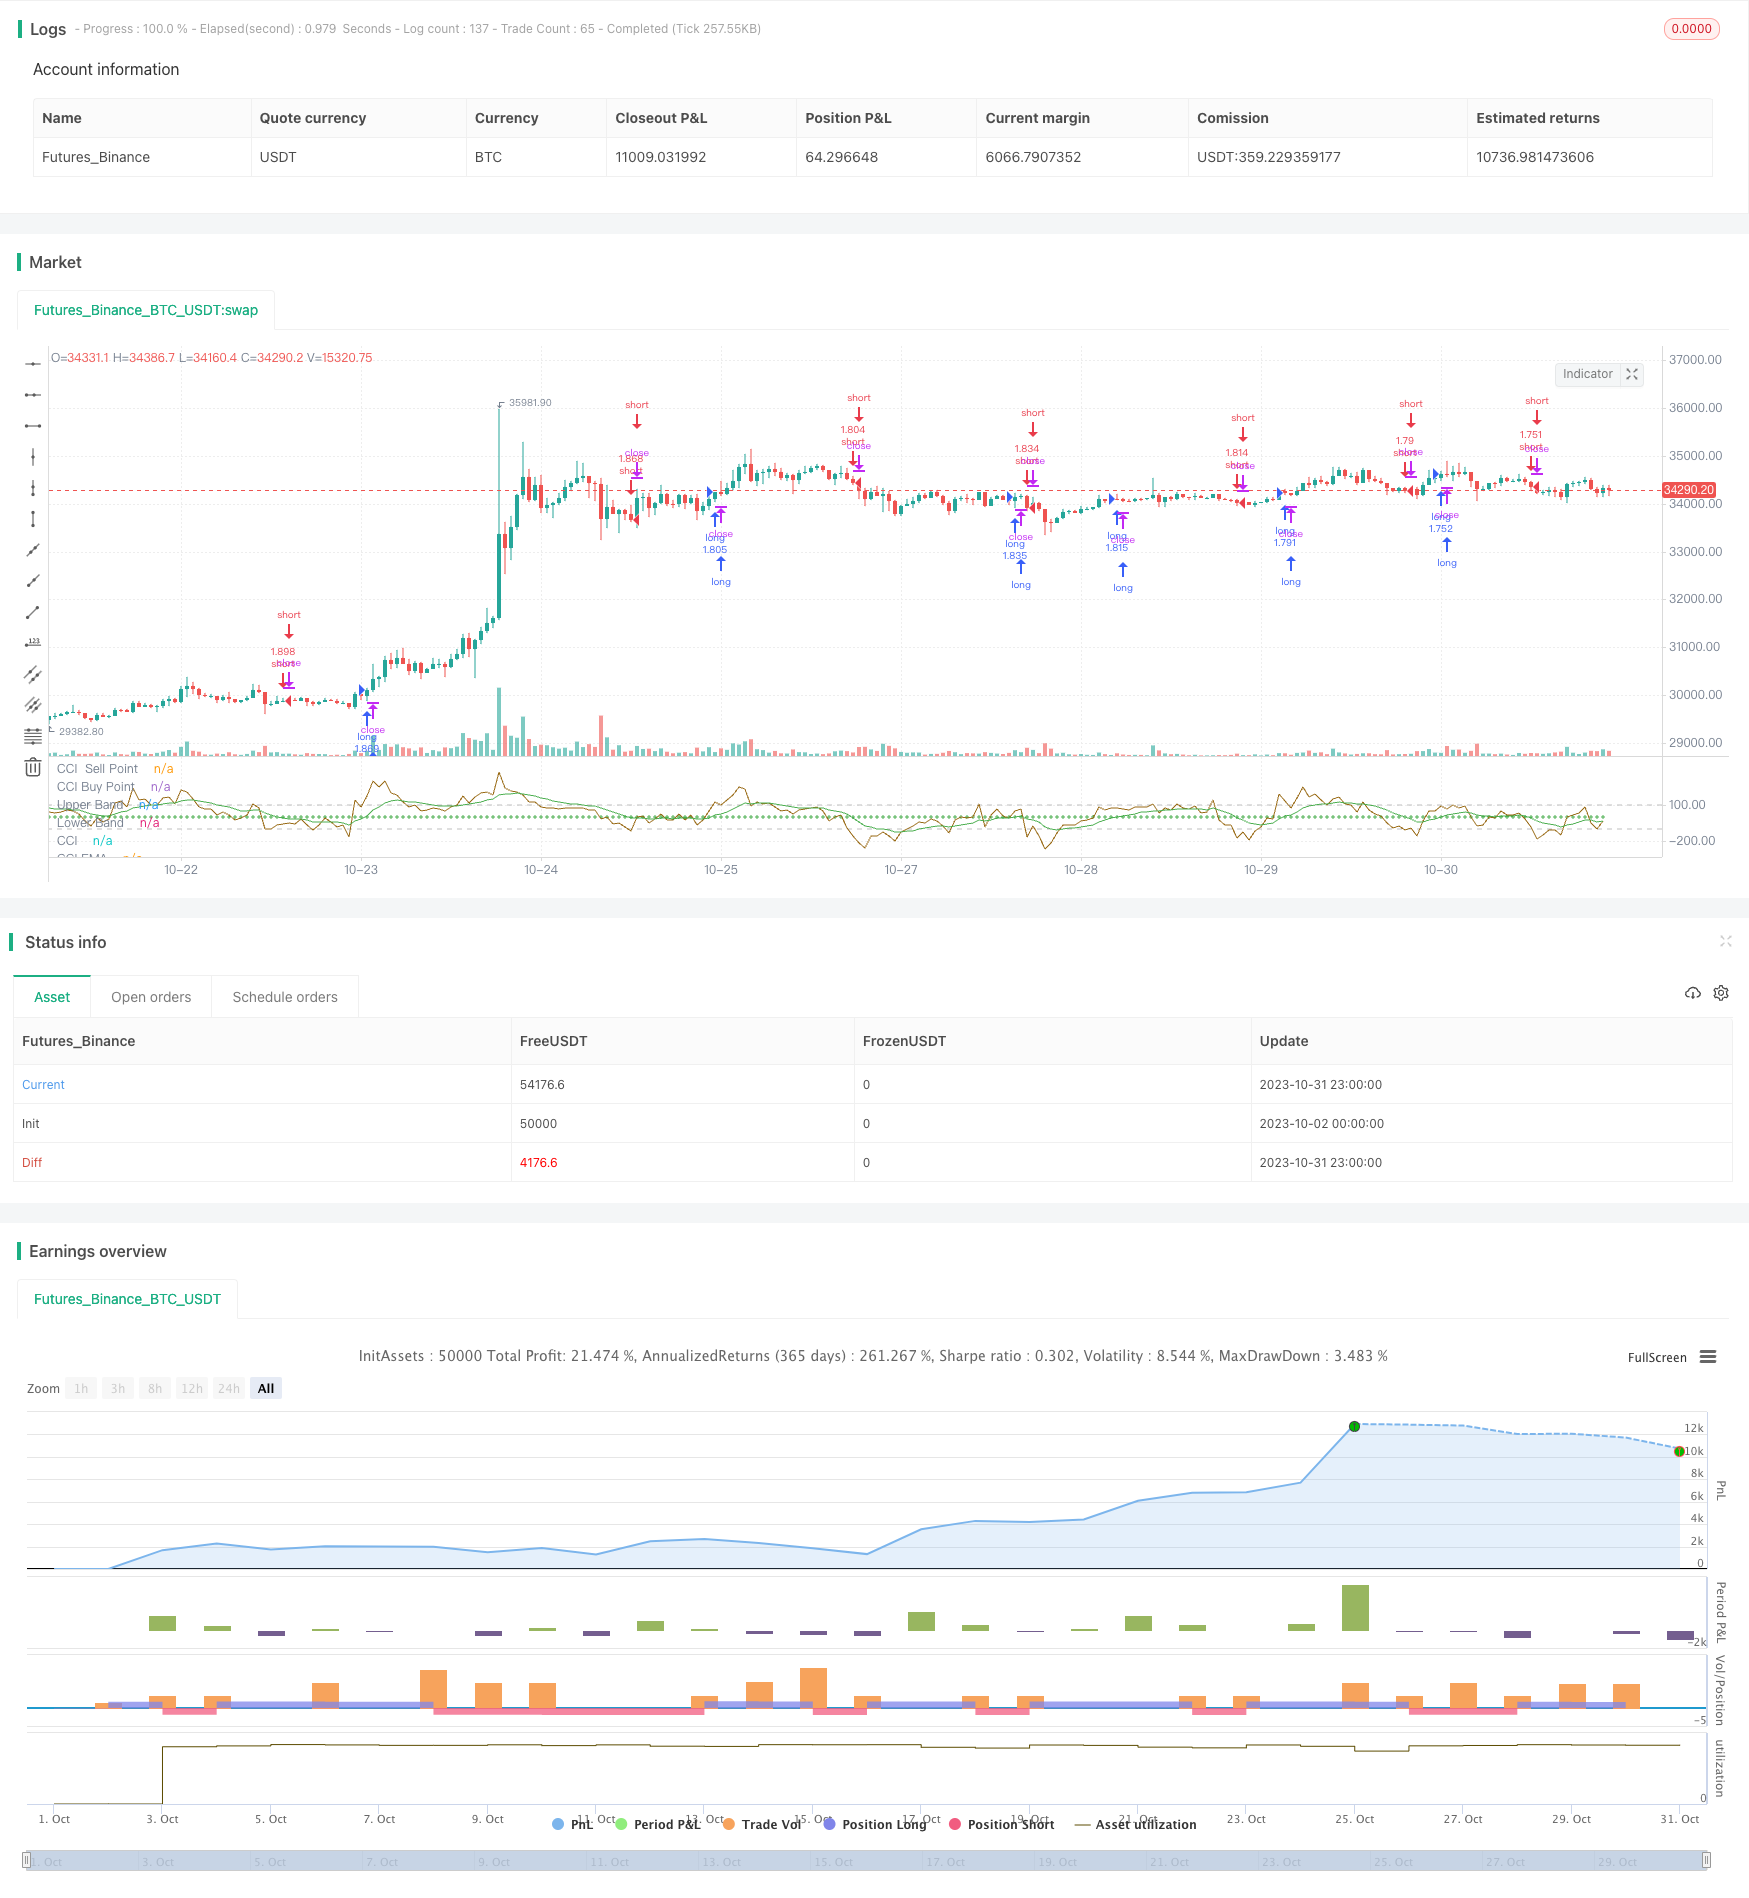
/*backtest
start: 2023-10-02 00:00:00
end: 2023-11-01 00:00:00
period: 1h
basePeriod: 15m
exchanges: [{"eid":"Futures_Binance","currency":"BTC_USDT"}]
*/

//@version=4
strategy("CCI with EMA Strategy", overlay=false, pyramiding=1, default_qty_type= strategy.percent_of_equity, default_qty_value = 100, calc_on_order_fills=false, slippage=0,commission_type=strategy.commission.percent,commission_value=0.07)

length = input(20, minval=1)
src = input(close, title="Source")
cciSellPoint = input(0, title = 'CCI Sell Point', type = input.integer)
cciBuyPoint = input(0, title = 'CCI Buy Buy Point', type = input.integer)
lengthcci = input(12,"length cci ema", minval=1)

ma = sma(src, length)
cci = (src - ma) / (0.015 * dev(src, length))
cciema=ema(cci,lengthcci)
plot(cci, "CCI", color=#996A15)
plot(cciSellPoint, title = 'CCI  Sell Point', color = color.red, linewidth = 1, style = plot.style_cross, transp = 35)
plot(cciBuyPoint, title = 'CCI Buy Point', color = color.green, linewidth = 1, style = plot.style_cross, transp = 35)
plot(cciema, title = 'CCI EMA', color = color.green, linewidth = 1, transp = 35)
band1 = hline(100, "Upper Band", color=#C0C0C0, linestyle=hline.style_dashed)
band0 = hline(-100, "Lower Band", color=#C0C0C0, linestyle=hline.style_dashed)
fill(band1, band0, color=#9C6E1B, title="Background")

startLongTrade=  cciema >cciBuyPoint
startShortTrade= cciema <cciSellPoint

//exitLong = cciema <cciSellPoint
//exitShort = cciema >cciBuyPoint

strategy.entry("long",strategy.long, when = startLongTrade )
//strategy.close( "long", when=exitLong)
strategy.entry("short",strategy.short,when=startShortTrade )
//strategy.close("short", when=exitShort)