Mean Reversion Breakout Low Strategy

Overview
The main idea of this strategy is to detect if the price breaks through the lowest price in a specified period and go long, waiting for the price to revert to the mean. It belongs to trend following strategies.
Strategy Logic
The strategy gets the lowest price in a specified period lowestLow using Pine Script's ta.lowest method and compares it with the lowest price of the previous period prevLow.
If the latest period's lowest price lowestLow is lower than the previous period's lowest price prevLow, a long signal is triggered. After going long, it compares with the highest price in the specified period highestHigh. If the latest period's highest price is greater than the previous highest price, it closes the position.
The strategy allows choosing the trigger condition, i.e. the lowest price needs to break through 1, 2, 3 or 4 previous lowest prices consecutively, to control the trading frequency.
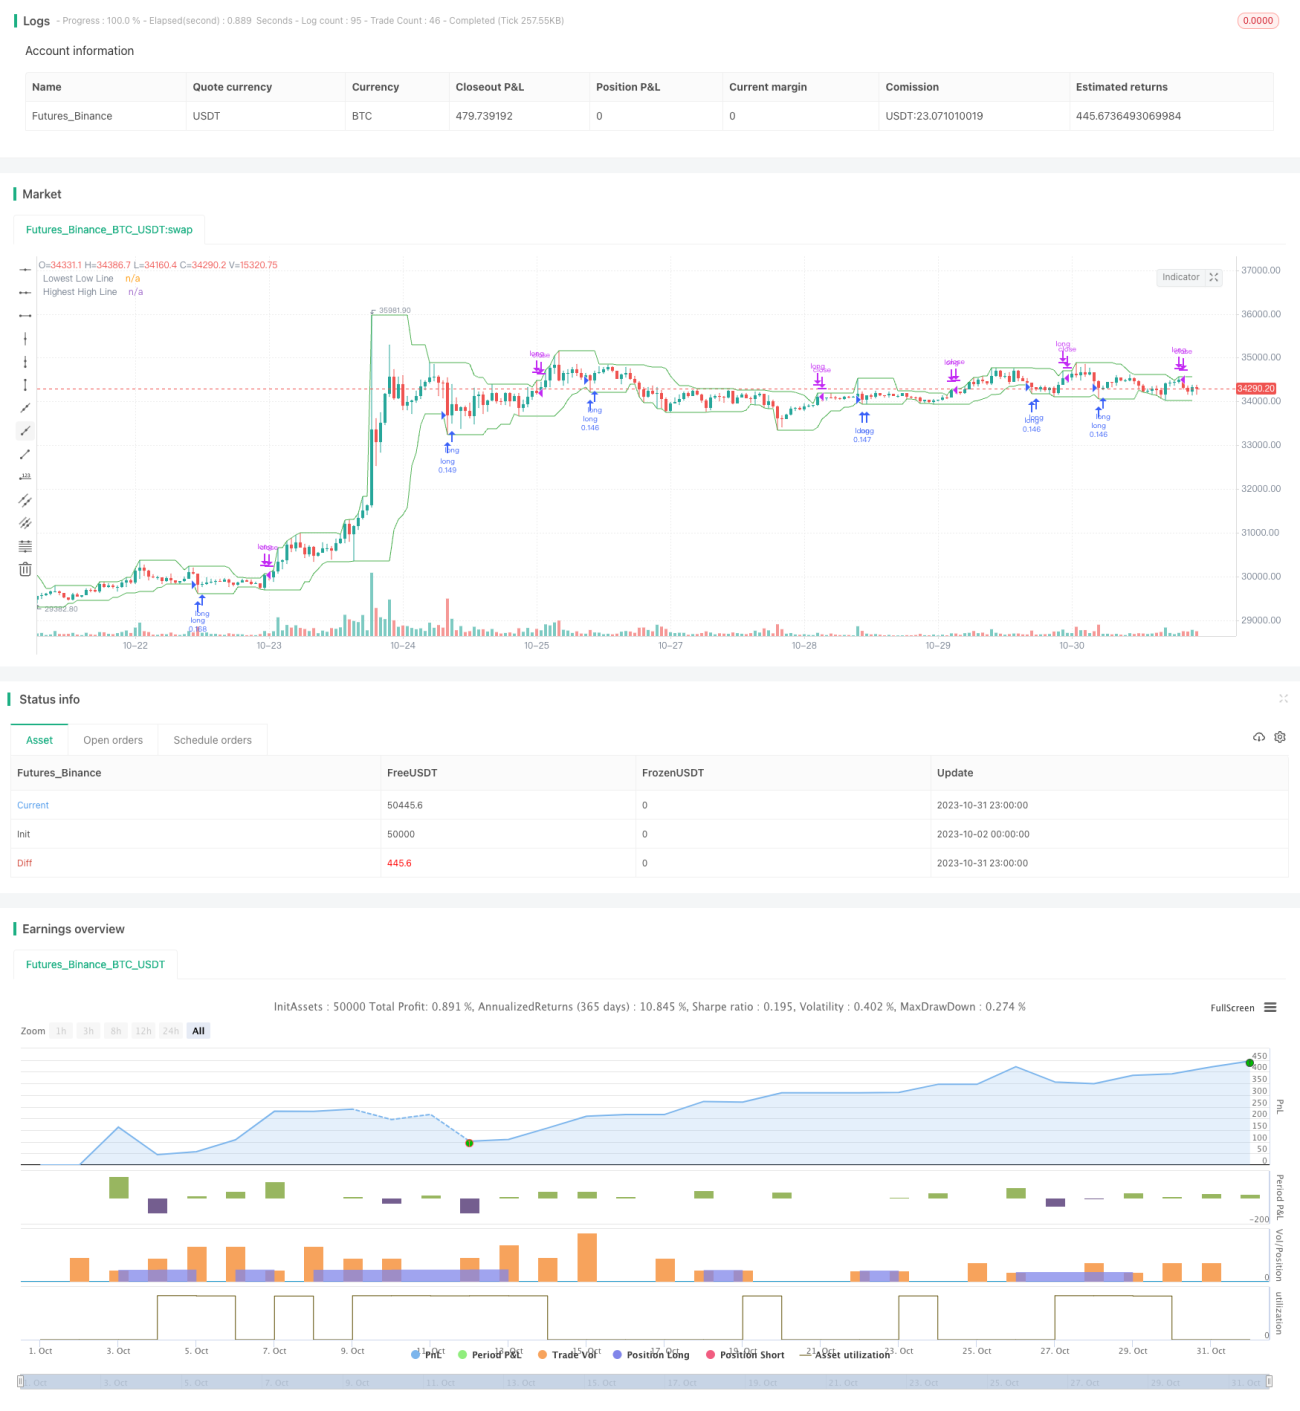
It also plots the lowest price line lowestLow and highest price line highestHigh on the chart to visually display the trend change.
Advantage Analysis
-
The strategy catches the reversal trend after breaking new lows with relatively high win rate.
-
Allows choosing the number of broken lowest prices to control trading frequency.
-
Drawing the lines helps visually determine trend change points.
-
Simple and clear strategy logic, easy to understand and implement.
-
Can be configured and optimized on different stocks and time periods.
Risk Analysis
-
Breaking false bottom cannot determine trend reversal points, may lead to losses.
-
Needs to test different parameter combinations to optimize configurations, otherwise trading frequency may be too high or too low.
-
Parameters need to be adjusted for different stocks, should not mechanically apply.
-
Insufficient backtest period may cause overfitting.
-
Price may make new lows after breaking out, need to set stop loss to control risks.
Optimization Directions
-
Add stop loss mechanisms like moving stop loss, trailing stop loss, to limit per trade loss.
-
Optimize the number of breakouts to balance trading frequency and signal quality.
-
Test parameters on different stocks and time periods.
-
Add filters to avoid frequent trading in ranging markets.
-
Consider adding trend indicators to avoid counter trend trading.
-
Test different exit signals.
Conclusion
The strategy catches reversal opportunities by monitoring lowest price breakouts, a typical mean reversion breakout strategy. The advantages are simplicity, controllable frequency, and applicability to various stocks. But it also has some false breakout risks. Adding filters and optimizing is necessary, as well as controlling risks. With comprehensive testing and optimization, it can become a stable and reliable trading system.
- 1