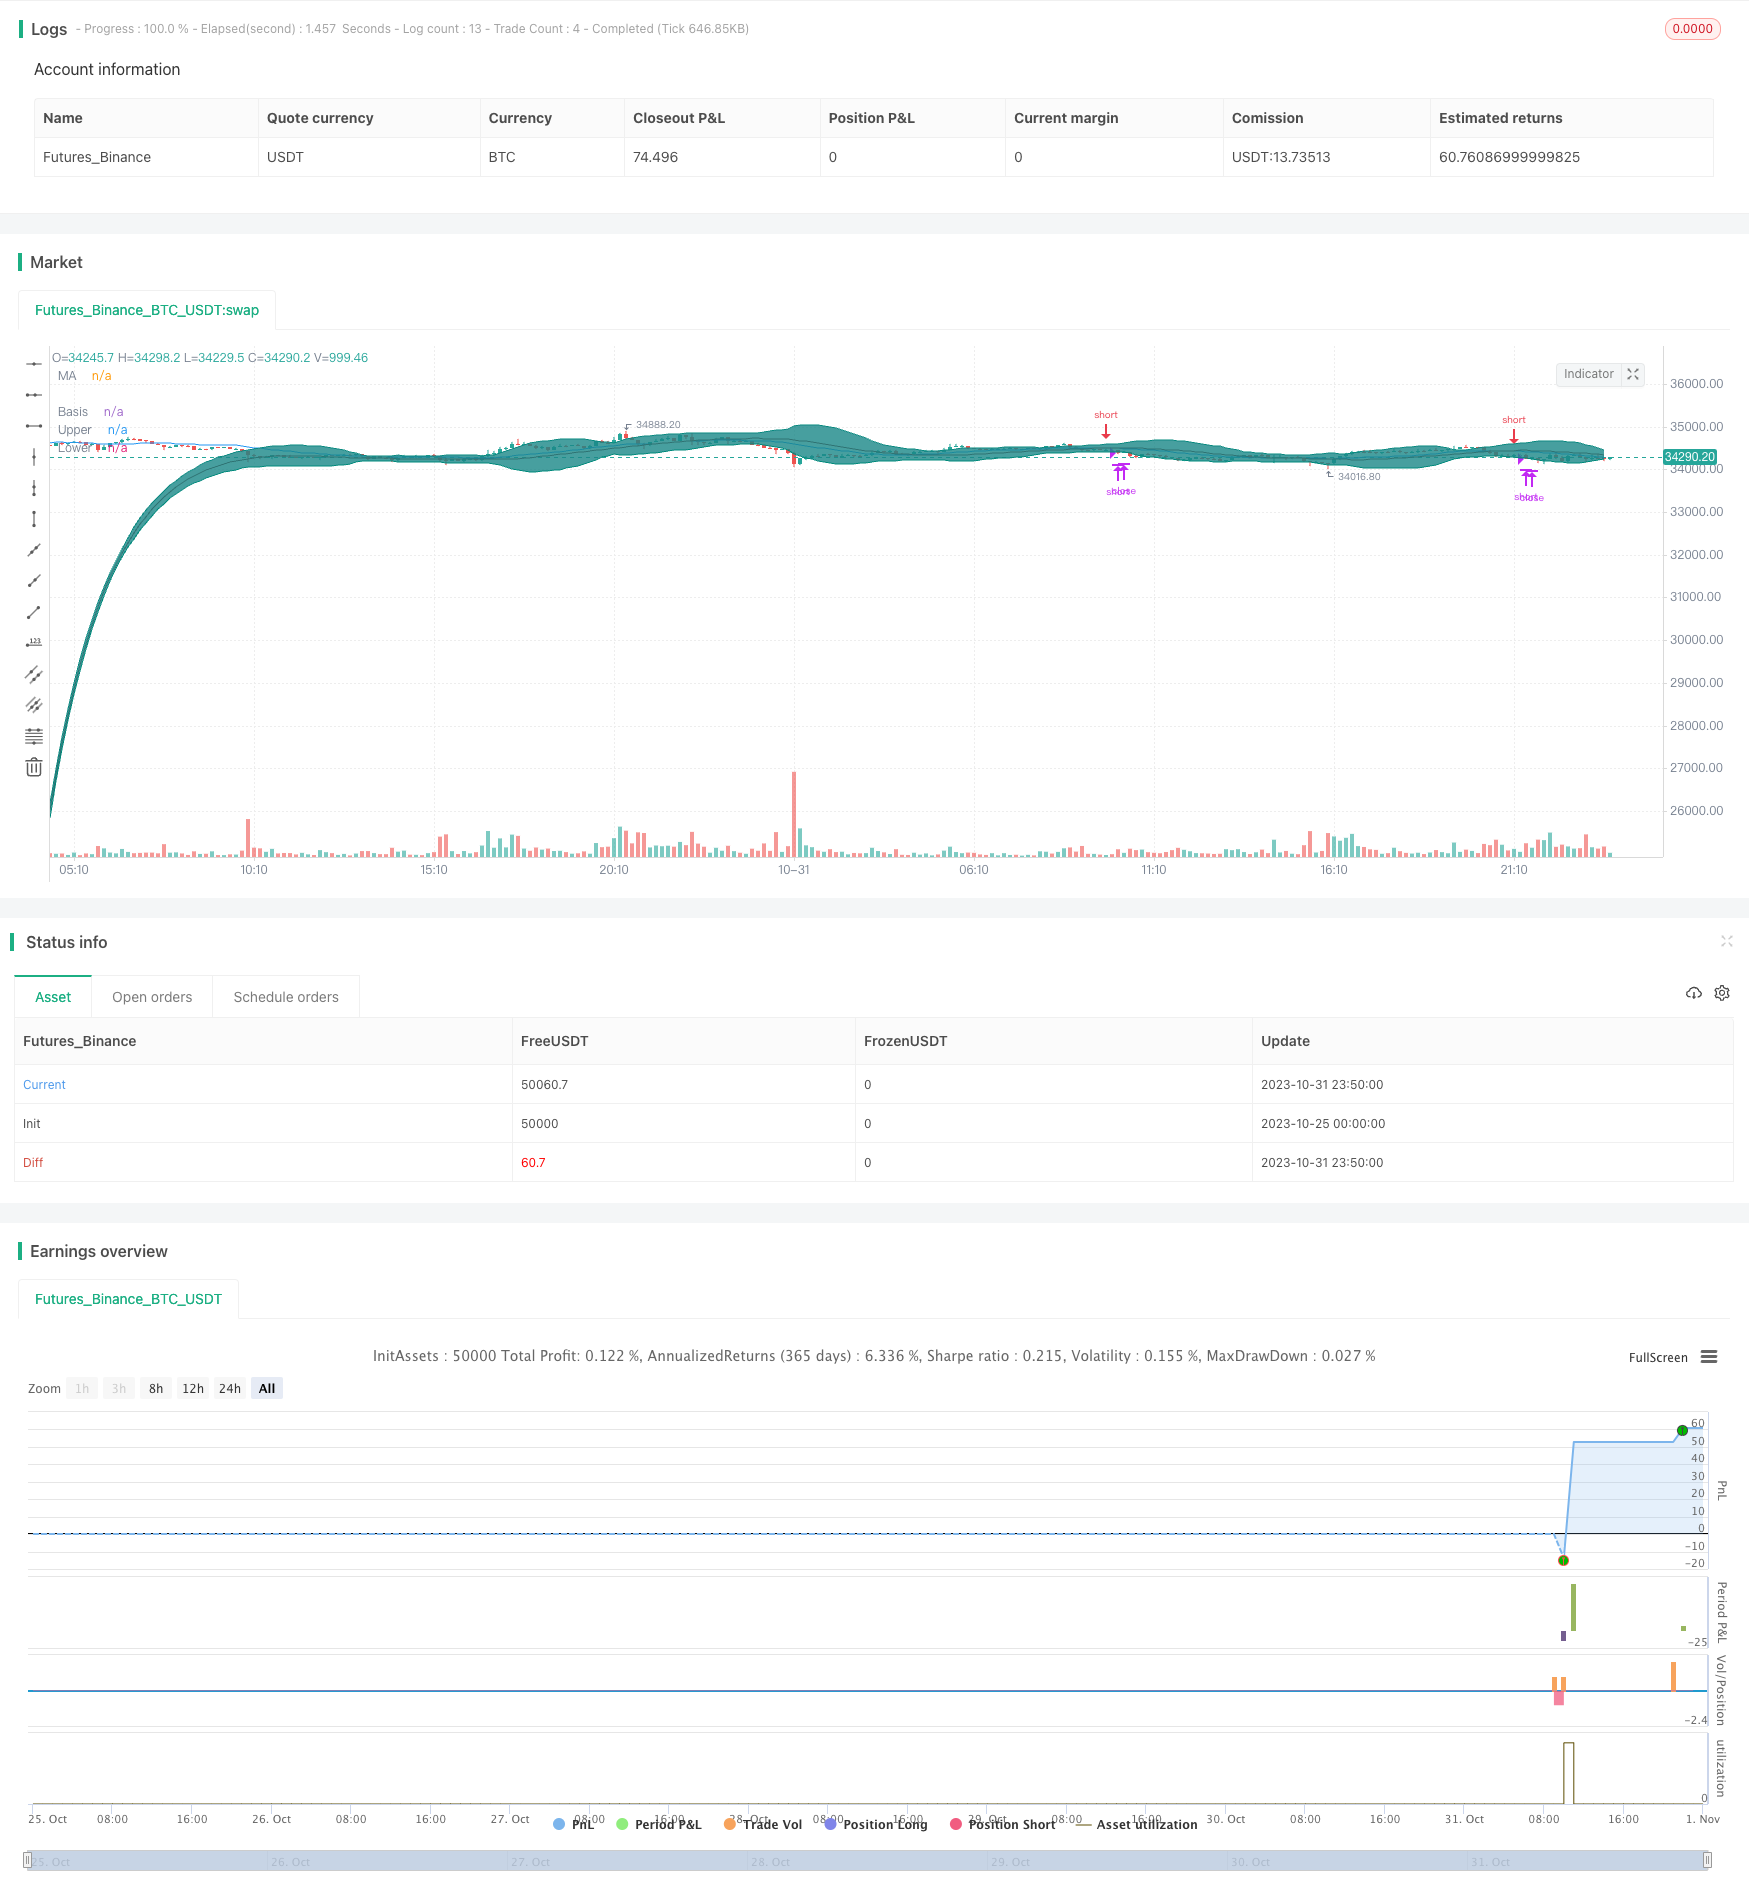
概述
该策略充分利用均线的趋势判断功能和布林带的超买超卖判定,辅以T3平滑均线过滤震荡,实现在趋势发生转折的时候及时判断形态并进入场内,在震荡区间利用布林带识别超买超卖区域来进行反向操作,实现超短线交易。
策略原理
该策略主要利用三组均线来识别趋势和进行交易信号判断。首先是T3均线,通过多次指数平滑起到滤波作用,可以有效过滤价格震荡,判断趋势方向。其次是中期均线,这里采用了长度为20的SMA均线,来判断中期趋势方向。最后是快慢均线,分别取长度50和200的T3均线,快线大于慢线表明处于上升趋势,否则为下降趋势。
交易信号的判断是,当中期均线发生金叉时结合上升趋势去做多,当中期均线发生死叉时结合下降趋势去做空。此外,还利用布林带上下轨进行情况判断,如果价格突破上轨会考虑止盈,如果下破下轨会考虑止损。
具体来说,做多的条件是中期均线上穿中期T3均线,且快线大于慢线,做多后如果价格突破布林带上轨或者中期均线下穿T3均线就考虑止盈;做空的条件是中期均线下穿T3均线,且快线小于慢线,做空后如果价格跌破布林带下轨或者中期均线上穿T3均线就考虑止损。
策略优势
- 利用多组均线充分发挥各自的优势,T3平滑去噪,中期SMA判断趋势,快慢均线判断长期趋势
- 布林带上下轨判断超买超卖区域,降低亏损风险
- 交易信号组合严格,可有效过滤震荡误导
策略风险
- T3均线参数设置不当可能无法有效滤波,也会造成滞后
- 布林带参数设置不当,可能导致上下轨无效
- 均线周期选择不当,可能判断错误趋势方向
- 突破上下轨止盈止损点设置不精确,可能止盈过早或止损过晚
优化方法: - 调整T3均线参数,取得平滑去噪和滞后平衡 - 调整布林带参数,使上下轨包裹正常波动范围 - 测试不同周期均线参数,找到适合品种的周期参数 - 根据回测结果优化止盈止损点
策略优化方向
- 增加趋势强弱判断,如ADX,避免趋势转折被套
- 增加波动率指标,根据市场波动调整参数
- 增加移动止损,追踪止损让利润更多流出
- 可以考虑breakout策略,突破上下轨之后再追踪止损
总结
该策略整体来说,利用均线系统性地判断趋势,利用布林带识别超买超卖区域,可在趋势发生转折时及时判断形态进入场内,并且能够有效控制风险。但需要注意参数调整与优化,才能真正发挥策略的效果。如果进一步结合趋势强度指标、波动率指标,以及移动止损技术进行优化,可以使策略更具弹性与智能。
策略源码
/*backtest
start: 2023-10-25 00:00:00
end: 2023-11-01 00:00:00
period: 10m
basePeriod: 1m
exchanges: [{"eid":"Futures_Binance","currency":"BTC_USDT"}]
*/

//@version=4
strategy(shorttitle="BB T3 Strategy", title="BB T3 Strategy", overlay=true)

//T3
b = 0.7
c1 = -b*b*b
c2 = 3*b*b+3*b*b*b
c3 = -6*b*b-3*b-3*b*b*b
c4 = 1+3*b+b*b*b+3*b*b

t3(len) => c1 * ema(ema(ema(ema(ema(ema(close, len), len), len), len), len), len) + c2 * ema(ema(ema(ema(ema(close, len), len), len), len), len) + c3 * ema(ema(ema(ema(close, len), len), len), len) + c4 * ema(ema(ema(close, len), len), len)
//T3 end

length = input(20, minval=1)

mult = input(2.5, minval=0.001, maxval=50, title="StdDev")
basis = t3(length)
basisDev = t3(length/10)

dev = mult * stdev(basisDev,length)
upper = basis + dev
lower = basis - dev
offset = input(0, "Offset", type = input.integer, minval = -500, maxval = 500)
plot(basis, "Basis", color=#872323, offset = offset)
p1 = plot(upper, "Upper", color=color.teal, offset = offset)
p2 = plot(lower, "Lower", color=color.teal, offset = offset)
fill(p1, p2, title = "Background", color=#198787, transp=95)

stoploss = input(true, "Stop Loss")

basisSma = sma(close, length)
p3 = plot(basisSma, color=color.blue, title="MA", offset=offset)

fastT3 = t3(50)
slowT3 = t3(200)

crossUp = crossover(basisSma, basis)
crossDown = crossunder(basisSma, basis)
bollBounce = crossover(close, upper)
bollReject = crossunder(close, lower)
underBasis = crossunder(close, basis)
overBasis = crossover(close, basis)

trendUp = fastT3 > slowT3
trendDown = fastT3 < slowT3

strategy.entry("long", strategy.long, when=(trendUp and crossUp), stop=(stoploss ? high+syminfo.mintick : na))
strategy.close("long", when=(bollBounce or crossDown or underBasis))
strategy.entry("short", strategy.short, when=(trendDown and crossDown), stop=(stoploss ? low-syminfo.mintick : na))
strategy.close("short", when=(bollReject or crossUp or overBasis))