DAKELAX-XRPUSDT Bollinger Band Mean Reversion Strategy

Overview
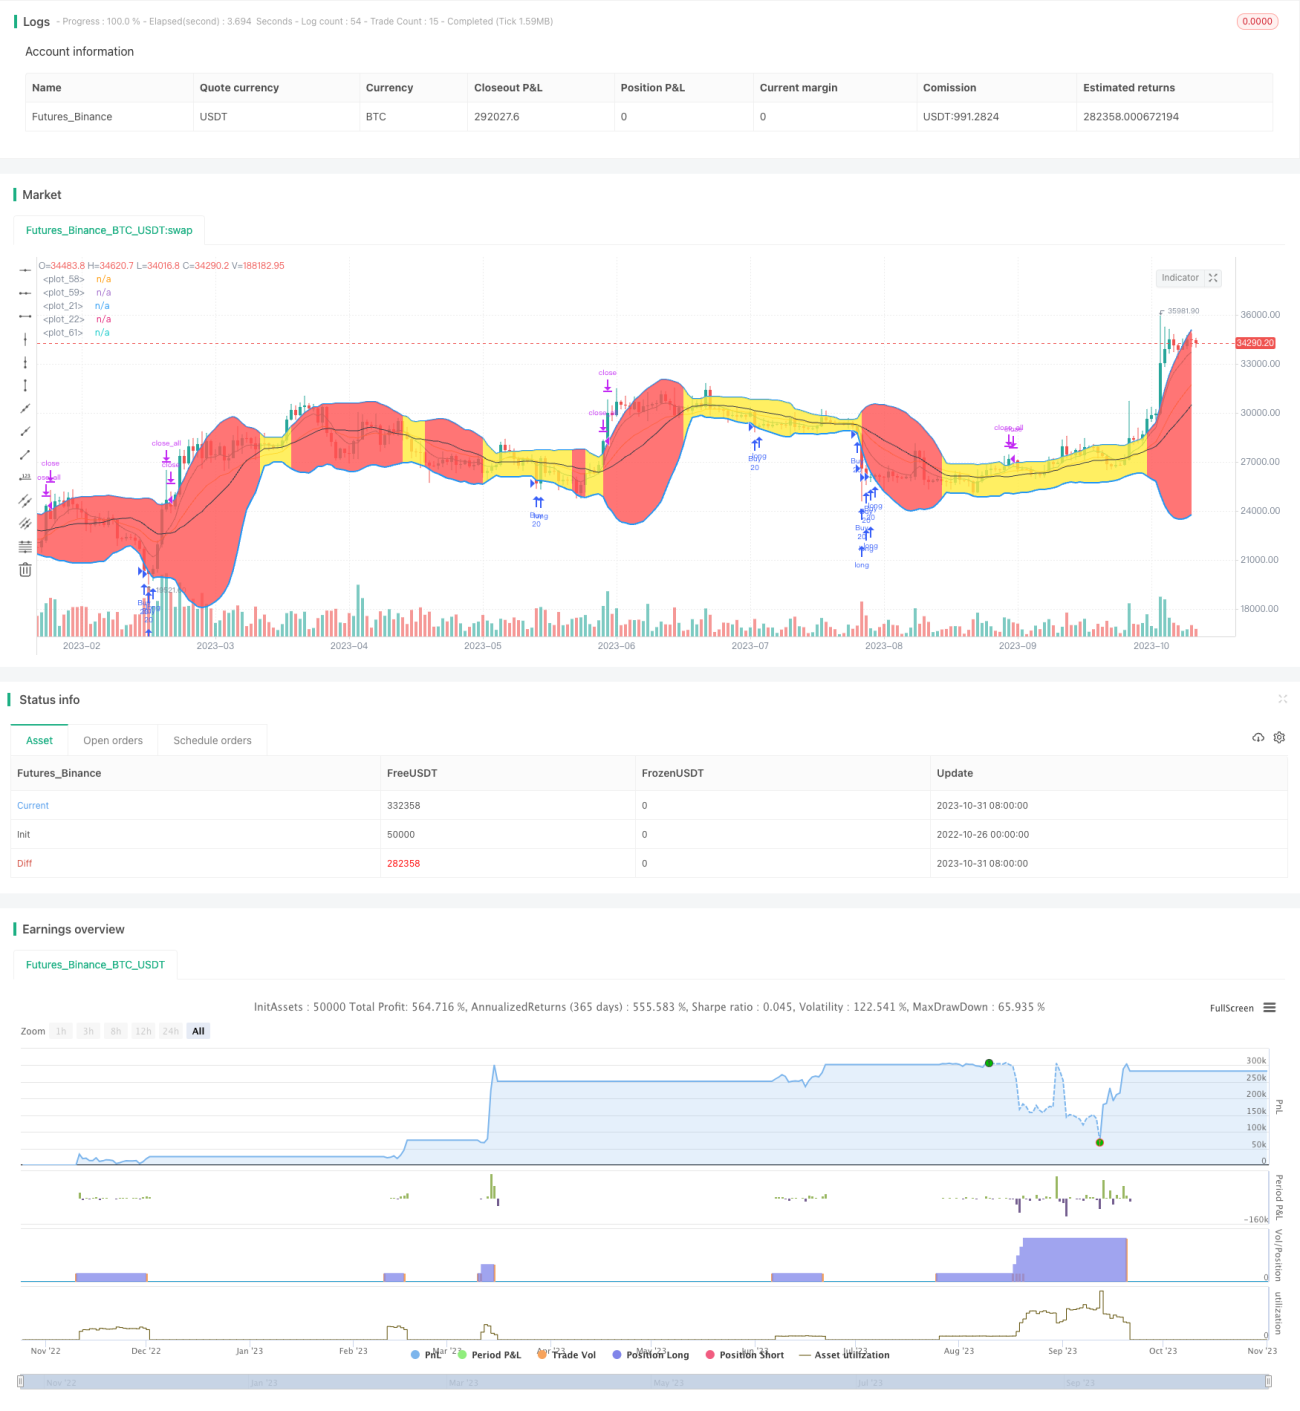
DAKELAX-XRPUSDT is a trading bot strategy for XRPUSDT on Binance. It is a simple reverse to mean strategy using Bollinger Bands, and performs well in backtest on H1 timeframe from May to Aug 2019, as well as running live.
Strategy Logic
The strategy first calculates the 20-period SMA and upper/lower Bollinger Bands. The upper band is SMA + 1.5 standard deviation, and the lower band is SMA - 2.2 standard deviation. It then calculates the contraction rate of the bands. Bands are filled black if contraction > 1.3, yellow if < 0.1, else red.
When close price is below the lower band, it goes long with 20 coins. When close is above upper band, it closes all positions.
The strategy also calculates 7-period EMA fast line and 18-period EMA slow line. Crossover of fast line above slow line is buy signal, and crossover below is sell signal.
Advantage Analysis
- Bollinger Bands and contraction rate intuitively identify trends and volatility
- Combine with EMA crossover adds strength to signals
- Good backtest results and relatively stable in live trading
Risk Analysis
- High probability of failure when breakout after band contraction
- Fixed amount buying without position sizing risks overtrading
- Too many crossovers in ranging markets risks losses
- Only considers daily factors, misses larger timeframe trends
Consider dynamic position sizing or stop loss to control risks. Optimize crossover strategy to avoid whipsaws in ranging markets. Add higher timeframe trend indicators to identify larger moves.
Optimization Directions
-
Adjust buy amount based on band width, less when contracted and more when expanded
-
Consider accumulating positions when contraction seen but signal not triggered yet
-
Add longer timeframe trend INDICATOR to determine overall direction, pause strategy when unclear
-
Incorporate stop loss to control risk, can set near recent lows of bands
-
Optimize crossover parameters like EMA periods to avoid getting trapped
Summary
DAKELAX-XRPUSDT is a trading bot strategy using Bollinger Band contraction with EMA crossover. It is intuitive and has good backtest results but contains some risks. These can be reduced through position sizing, stopping strategy, adding stop loss and optimizing crossover logic. Overall it provides a clear example of a Bollinger Band strategy, but requires pair-specific optimization for stable live profits.
/*backtest
start: 2022-10-26 00:00:00
end: 2023-11-01 00:00:00
period: 1d
basePeriod: 1h
exchanges: [{"eid":"Futures_Binance","currency":"BTC_USDT"}]
*/

//@version=3
//study(title="Tradebotler DAKELAX Binance:XRPUSDT Study-strategy", overlay=true)
strategy(title="Tradebotler DAKELAX Binance:XRPUSDT Strategy", overlay=true)
- 1