Bull Market Buy Dips Strategy

Overview
The Bull Market Buy Dips strategy aims to buy the dips in bull market by utilizing RSI indicator and confirm the trend by double moving averages. When the price gets back to the uptrend, the moving averages crossover is used as profit taking signal.
Strategy Logic
The strategy first sets the backtesting start and end date, then configures the parameters for RSI and fast/slow moving averages.
The strategy signal logic is:
-
When RSI drops below the threshold (default 35), it triggers buy signal as it indicates oversold area.
-
The fast MA needs to be above slow MA, which confirms the current uptrend and avoids buying in consolidation.
-
When price goes above fast MA and fast MA is above medium MA, it triggers close signal to take profit.
The reasonable application of RSI and MA crossover principles helps catch pullback opportunities in bull market and take profits once the price resumes trend.
Advantage Analysis
- RSI effectively identifies oversold levels
- Fast/slow MAs determine the major trend and avoid buying in ranging market
- MA crossover again suggests the resumption of trend for timely profit taking
RSI is very suitable for catching reversal points. Buying when RSI enters oversold area allows accurately locking oversold opportunities. Using MAs to determine the trend can filter ranging market and prevent repeated buying in consolidation. Finally, the MA crossover confirms the trend again for timely taking profit and avoiding pullback loss.
Risk Analysis
- Improper RSI parameter may fail to identify oversold area effectively
- Wrong selection of MA parameters may generate multiple false signals
- Premature or delayed profit taking
If RSI parameter is set too wide or too narrow, it may lose the accuracy in judging oversold levels. Wrongly chosen fast or slow MA periods could also lead to false trend determination. If profit taking timing is improper, too early may miss further profits while too late may sacrifice gained profits.
Parameters of RSI can be optimized, suitable MA periods can be selected, and different profit taking mechanisms can be tested to improve profit taking performance.
Optimization Directions
- Test RSI parameters of different periods
- Try different MA combinations
- Attempt other profit taking mechanisms like trailing stop, breakout stop etc
- Optimize position sizing
- Consider trading cost impact
Different RSI periods can be tested to optimize oversold area judgment. Different MA period combinations can be tried to find the best parameters for trend determination. Other profit taking mechanisms like trailing stop, resistance stop can also be tested. Optimizing position sizing can better control risks. Finally, considering trading costs can make the strategy closer to live trading.
Summary
The Bull Market Buy Dips strategy has clear and sensible logic overall, skillfully utilizes RSI and MA principles to capture buying and profit taking timing in trending market. Through parameter optimization, profit taking tests and position sizing management, the robustness and real trading performance can be further enhanced. With simple and practical idea, this strategy is suitable for catching pullbacks in bull market and can bring decent profits to the portfolio.
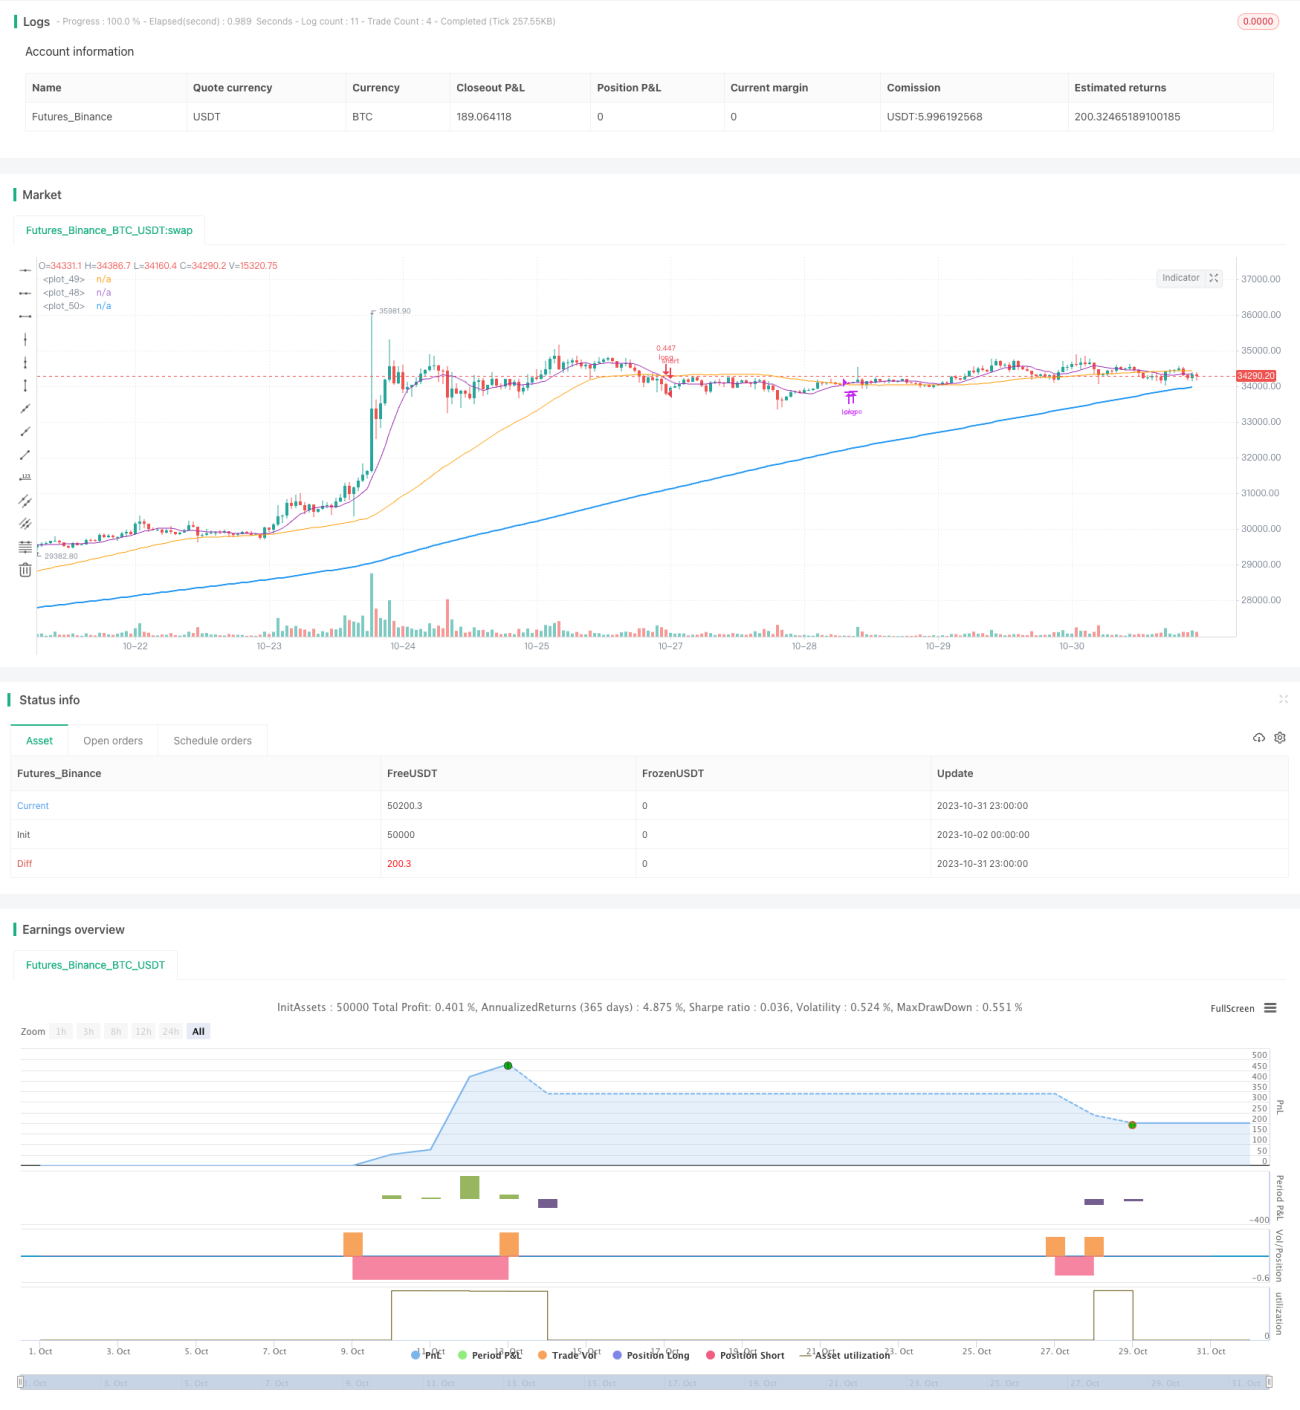
/*backtest
start: 2023-10-02 00:00:00
end: 2023-11-01 00:00:00
period: 1h
basePeriod: 15m
exchanges: [{"eid":"Futures_Binance","currency":"BTC_USDT"}]
*/

//@version=4
strategy(shorttitle='Buy The Dips in Bull Market',title='Buy The Dips in Bull Market (by Coinrule)', overlay=true, initial_capital = 1000, default_qty_type = strategy.percent_of_equity, default_qty_type = strategy.percent_of_equity, default_qty_value = 30, commission_type=strategy.commission.percent, commission_value=0.1)

//Backtest dates- 1