Coordinate Sliding Stop Loss Strategy

Author: ChaoZhang, Date: 2023-11-02 16:28:55
Tags:

img

Overview

This strategy uses Stochastic RSI and price rate of change indicator to identify trend direction for entry, and coordinate sliding stop loss for risk management.

Strategy Logic

Firstly, the strategy calculates Stochastic RSI using RSI indicator with length 5 and Stochastic indicator with length 7. When Stochastic RSI K value is above D value, it is bullish signal. When K is below D, it is bearish signal.

Secondly, the strategy calculates price rate of change indicator EMA ROC. When EMA ROC is above the threshold half or below negative half of threshold, it identifies active price movement.

Then, combining Stochastic RSI signals and price rate of change, it identifies trend direction. When Stochastic RSI is bullish and price actively moving, go long. When Stochastic RSI bearish and price actively moving, go short.

Finally, the strategy uses coordinate sliding stop loss for risk management. After opening position, it continues to refresh highest/lowest price, and uses certain percentage distance from highest/lowest price as stop loss level.

Advantage Analysis

The advantages of this strategy:

  1. Stochastic RSI indicator effectively identifies trends and overbought/oversold situations.

  2. Price rate of change filters out range-bound market to avoid false signals.

  3. Coordinate sliding stop loss can lock in profits to the largest extent while controlling risk.

  4. The strategy has big optimization space for parameters tuning based on different products.

  5. The strategy logic is simple and clear, easy to understand and implement.

Risk Analysis

The risks of this strategy:

  1. Stochastic RSI may generate false signals, needs confirmation with other factors.

  2. Coordinate sliding stop loss may be too aggressive, could be stopped out by gaps overnight.

  3. Short term reversal may trigger stop loss.

  4. Parameters need optimization for different products, otherwise performance may be poor.

  5. Trading cost impacts the strategy profitability, reasonable trading frequency needed.

Optimization Directions

The strategy can be further optimized in the following aspects:

  1. Optimize Stochastic RSI parameters to reduce false signals. Can test different K and D values.

  2. Optimize price rate of change parameters to improve filtering effect. Can test different length and threshold values.

  3. Add trend indicator to avoid being stopped out by reversals. Such as moving averages.

  4. Optimize stop loss percentage to reduce risk of being trapped. Can test different stop loss width.

  5. Add position sizing management to control single trade risk. Such as fixed stop loss amount, or dynamically adjust position size based on account equity.

  6. Test parameters on different products to improve adaptiveness. Verify on multiple markets and timeframes.

Summary

In summary, this strategy has clear and simple logic, identifies trend direction with Stochastic RSI and filters signals with price rate of change, which can effectively capture mid-long term trends. Coordinate sliding stop loss locks in profits and controls risk. With further optimization, this strategy can become a very practical trend following strategy.
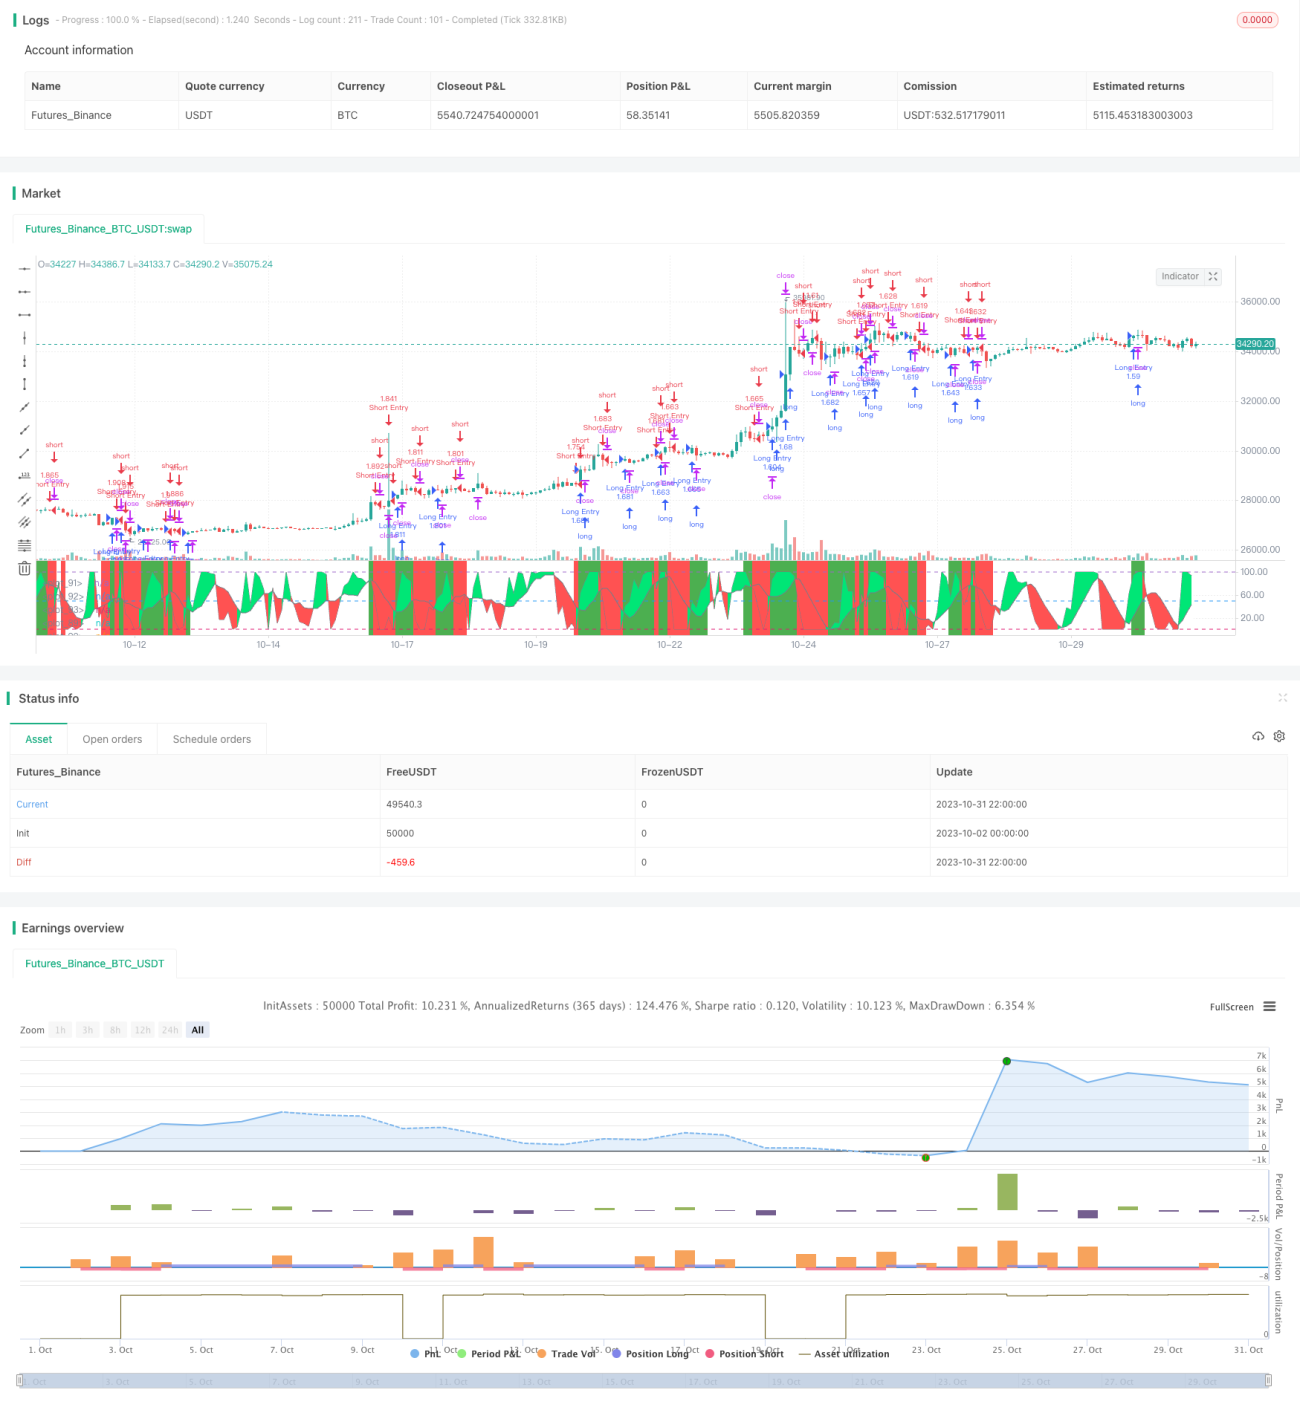

/*backtest
start: 2023-10-02 00:00:00
end: 2023-11-01 00:00:00
period: 2h
basePeriod: 15m
exchanges: [{"eid":"Futures_Binance","currency":"BTC_USDT"}]
*/

//@version=4
strategy("Sto2", overlay=false, initial_capital=10000, default_qty_type=strategy.percent_of_equity, default_qty_value=100, commission_type=strategy.commission.percent, commission_value=0.0)

/////////////// Time Frame ///////////////
testStartYear = input(2017, "Backtest Start Year") 
testStartMonth = input(1, "Backtest Start Month")
testStartDay = input(1, "Backtest Start Day")
testPeriodStart = timestamp(testStartYear,testStartMonth,testStartDay, 0, 0)

testStopYear = input(2019, "Backtest Stop Year")
testStopMonth = input(12, "Backtest Stop Month")
testStopDay = input(31, "Backtest Stop Day")
testPeriodStop = timestamp(testStopYear,testStopMonth,testStopDay, 0, 0)

testPeriod() => true
    
///////////// Stochastic calc /////////////
smoothK = input(1, minval=1)
smoothD = input(7, minval=1)
lengthRSI = input(5, minval=1)
lengthStoch = input(7, minval=1)
src = input(close, title="RSI Source")

up = sma(max(change(src), 0), lengthRSI) 
down = sma(-min(change(src), 0), lengthRSI)
rsi1 = down == 0 ? 100 : up == 0 ? 0 : 100 - (100 / (1 + up / down))

k = sma(stoch(rsi1, rsi1, rsi1, lengthStoch), smoothK)
d = sma(k, smoothD)

///////////// Rate Of Change ///////////// 
source = close, roclength = input(14, minval=1), pcntChange = input(2, minval=1)
roc = 100 * (source - source[roclength]) / source[roclength]
emaroc = ema(roc, roclength / 2)
isMoving() => emaroc > (pcntChange / 2) or emaroc < (0 - (pcntChange / 2))

/////////////// STRATEGY ///////////////
long = k > d and isMoving()
short = k < d and isMoving()

last_long = 0.0
last_short = 0.0
last_long := long ? time : nz(last_long[1])
last_short := short ? time : nz(last_short[1])

long_signal = crossover(last_long, last_short)
short_signal = crossover(last_short, last_long)

last_open_long_signal = 0.0
last_open_short_signal = 0.0
last_open_long_signal := long_signal ? open : nz(last_open_long_signal[1])
last_open_short_signal := short_signal ? open : nz(last_open_short_signal[1])

last_long_signal = 0.0
last_short_signal = 0.0
last_long_signal := long_signal ? time : nz(last_long_signal[1])
last_short_signal := short_signal ? time : nz(last_short_signal[1])

in_long_signal = last_long_signal > last_short_signal
in_short_signal = last_short_signal > last_long_signal

last_high = 0.0
last_low = 0.0
last_high := not in_long_signal ? na : in_long_signal and (na(last_high[1]) or high > nz(last_high[1])) ? high : nz(last_high[1])
last_low := not in_short_signal ? na : in_short_signal and (na(last_low[1]) or low < nz(last_low[1])) ? low : nz(last_low[1])
sl_inp = input(2.0, title='Stop Loss %') / 100
tp_inp = input(9.0, title='Take Profit %') / 100 
 
take_level_l = strategy.position_avg_price * (1 + tp_inp)
take_level_s = strategy.position_avg_price * (1 - tp_inp) 

since_longEntry = barssince(last_open_long_signal != last_open_long_signal[1]) // LONG SL
since_shortEntry = barssince(last_open_short_signal != last_open_short_signal[1]) // SHORT SL

slLong = in_long_signal ? strategy.position_avg_price * (1 - sl_inp) : na
slShort = strategy.position_avg_price * (1 + sl_inp)
long_sl = in_long_signal ? slLong : na
short_sl = in_short_signal ? slShort : na

// Strategy
if testPeriod()
    strategy.entry("Long Entry",  strategy.long, when=long)
    strategy.entry("Short Entry", strategy.short, when=short)
    strategy.exit("Long Ex", "Long Entry", stop=long_sl, limit=take_level_l, when=since_longEntry > 0)
    strategy.exit("Short Ex", "Short Entry", stop=short_sl, limit=take_level_s, when=since_shortEntry > 0)
    
///////////// Plotting /////////////
bgcolor(isMoving() ? long ? color.green : short ? color.red : na : color.white, transp=80)
p1 = plot(k, color=color.gray, linewidth=0)
p2 = plot(d, color=color.gray, linewidth=0)
h0 = hline(100)
h1 = hline(50)
h3 = hline(0)
fill(p1, p2, color = k > d ? color.lime : color.red, transp=70)

More