Breakout Trading Strategy

Overview
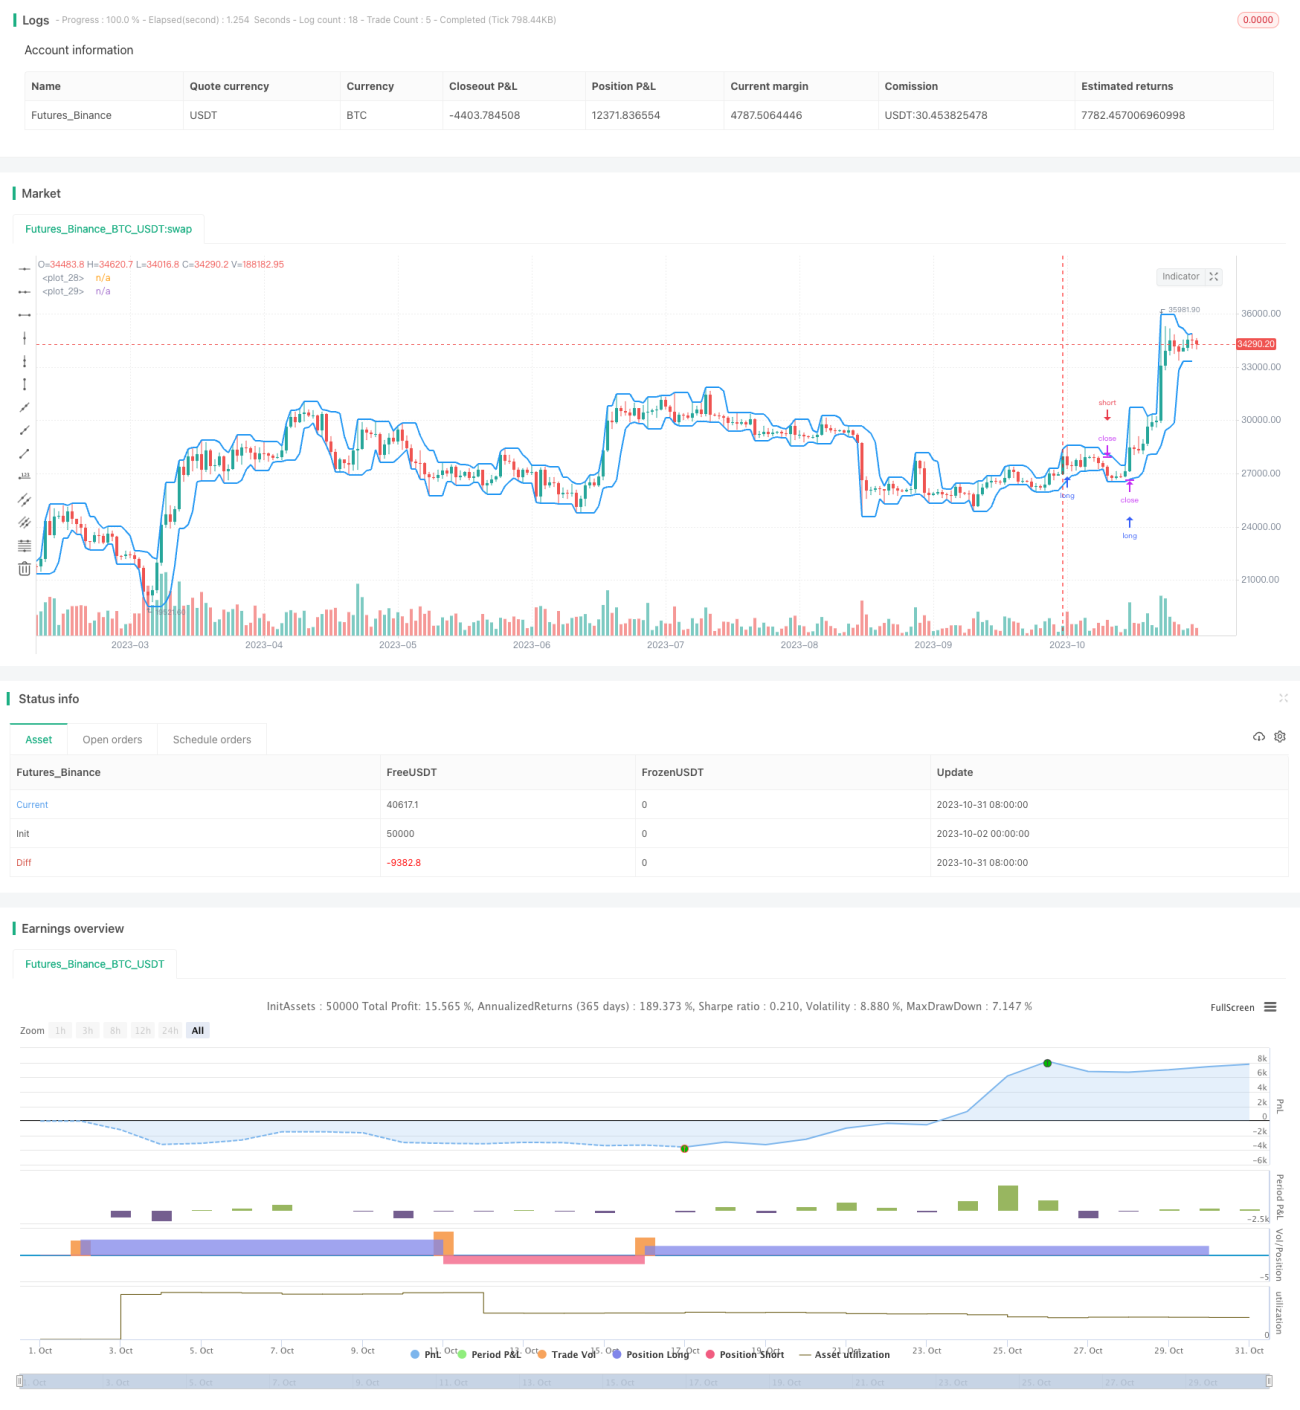
This strategy is based on the breakout theory, comparing the moving averages of highest and lowest prices to determine if the trend is reversing, in order to find potential breakout points and trade when breakout happens. The strategy is simple and straightforward, suitable for tracking symbols with drastic price changes.
Strategy Logic
This strategy first calculates the moving averages of highest and lowest prices within a user-defined period. The highest price moving average represents the upper band, and the lowest price moving average represents the lower band. When price breaks through the upper band, it signals an uptrend, and the strategy will open long position. When price breaks through the lower band, it signals a downtrend, and the strategy will open short position. Users can configure to only long or only short.
The strategy also provides optional stop loss and take profit settings. When long, the stop loss is set at upper band; when short, stop loss is set at lower band. This reduces losses. Users can also choose to set stop loss at the breakout point, i.e. when long, stop loss is lower band, and when short, stop loss is upper band. This allows more profit potential.
Advantages
The advantages of this strategy are:
-
The logic is simple and straightforward, easy to understand and implement.
-
It can quickly capture trend reversal points and adjust positions accordingly.
-
It provides optional stop loss and take profit settings to fit personal risk preference.
-
The trading signals are clear, without too many false signals.
-
There are few configurable parameters, easy to use.
-
Flexibility to configure long only or short only.
Risks
The risks of this strategy include:
-
Breakout signal may be false breakout and cannot sustain.
-
Improper breakout period setting may miss longer term trends.
-
It does not consider volume on breakout, may cause chasing highs and killing lows.
-
There is certain lag, may miss good portion of the move.
-
In volatile market, stop loss may get hit.
-
Relies solely on breakout for trading, profit is uncertain.
Enhancements
The strategy can be enhanced in the following aspects:
-
Incorporate volume indicator to avoid false breakouts. For example, enlarged volume on breakout signals validity.
-
Optimize moving average period parameter to match trend changes in different cycle. Also try different moving average types.
-
Set a pullback threshold after breakout for further confirmation to avoid false breakout.
-
Add Bollinger Bands etc. on top of breakout basis for more directional guidance.
-
Incorporate other INDICATORs like RSI, MACD for additional trading signals and improve accuracy.
-
Optimize stop loss and take profit strategies to better cope with market fluctuation while controlling risk.
Summary
The breakout trading strategy has a clear logic of tracking price breakout of upper and lower bands for entry and exit. There is large room for enhancement, by incorporating more indicator information and optimizing parameters to strengthen the strategy. After getting familiar with the basic logic, traders can customize parameters based on their needs and obtain good trading results.
- 1