Lion Fissure Balance Strategy

Overview
The Lion Fissure Balance strategy is a simple short-term trading strategy based on moving average crossovers. It mainly uses two moving averages - when the fast MA crosses above the slow MA from below, go long; when the fast MA crosses below the slow MA from above, close the position. The strategy name comes from the popular trading jargon "Lion Fissure", implying capturing minor price actions and profiting from the narrow gap between MAs.
Strategy Logic
The strategy uses two moving averages: a fast MA (smallMAPeriod) and a slow MA (bigMAPeriod). The two MAs form a price channel, with the fast MA as the channel base and the slow MA as the channel ceiling. When price breaks above the channel base upwards, go long; when price breaks the channel ceiling downwards, close position.
Specifically, the strategy first calculates the fast MA (smallMA) and slow MA (bigMA). It then calculates the buy line (buyMA), which is (100 - percentBelowToBuy)% of the slow MA. When the fast MA crosses above the buy line upwards, go long; when reaching 1% profit or holding 7 bars without profit, close position.
In summary, the strategy aims to capture the "Lion Fissure" between MAs for short-term profits. It also sets profit taking and stop loss conditions to control per trade risk.
Advantage Analysis
The strategy has the following advantages:
-
Simple concept easy to understand and implement. Dual MA crossovers are the most basic technical indicator strategy.
-
Easy backtesting. The strategy directly uses TradingView built-in backtester without extra implementation.
-
Powerful visualization. TradingView can directly show trade signals and statistical data on charts.
-
Controllable risk. The strategy sets profit taking and stop loss conditions to effectively control per trade loss.
-
Flexible customization. Users can adjust MA parameters and other indicators to suit different products and trading styles.
Risk Analysis
The strategy also has the following risks:
-
Potentially excessive signals. Dual MA strategies tend to generate false signals during consolidations.
-
Single indicator reliance. Using only MA crosses ignores other factors, potentially resulting in poor signal quality.
-
Difficult parameter optimization. Finding the optimal MA combination requires extensive computation.
-
Backtest bias. Simple dual MA strategies often perform better in backtests than live trading.
-
Difficult stop loss. Fixed stop loss levels may fail to adapt to changing market conditions.
Optimization Directions
The strategy can be improved from the following aspects:
-
Add other filters like volume and volatility to avoid ineffective signals during consolidations.
-
Incorporate trend bias to avoid counter-trend trading. Longer-period MAs can be added to determine trend direction.
-
Use machine learning to find optimal parameters, like sequential parameter optimization or genetic algorithms.
-
Enhance stop loss strategies, like trailing stop loss and adaptive stop loss for better flexibility.
-
Optimize entry timing using other indicators to identify higher probability entry points.
-
Conduct quantitative research and backtesting to improve stability of optimized parameter sets.
-
Develop automated trading systems to systematically optimize and evaluate parameter combinations.
Conclusion
The Lion Fissure Balance strategy is an excellent starter strategy for beginners to learn. It applies the simple dual MA crossover logic and sets profit taking and stop loss rules to capture short-term price swings. The strategy is easy to understand and implement, and shows good backtest results. However, it suffers from optimization difficulty and questionable live performance. We can improve the strategy by incorporating other indicators, optimizing parameters, and developing automated trading systems. Overall, the Lion Fissure Balance strategy provides a great learning platform for quantitative trading beginners.
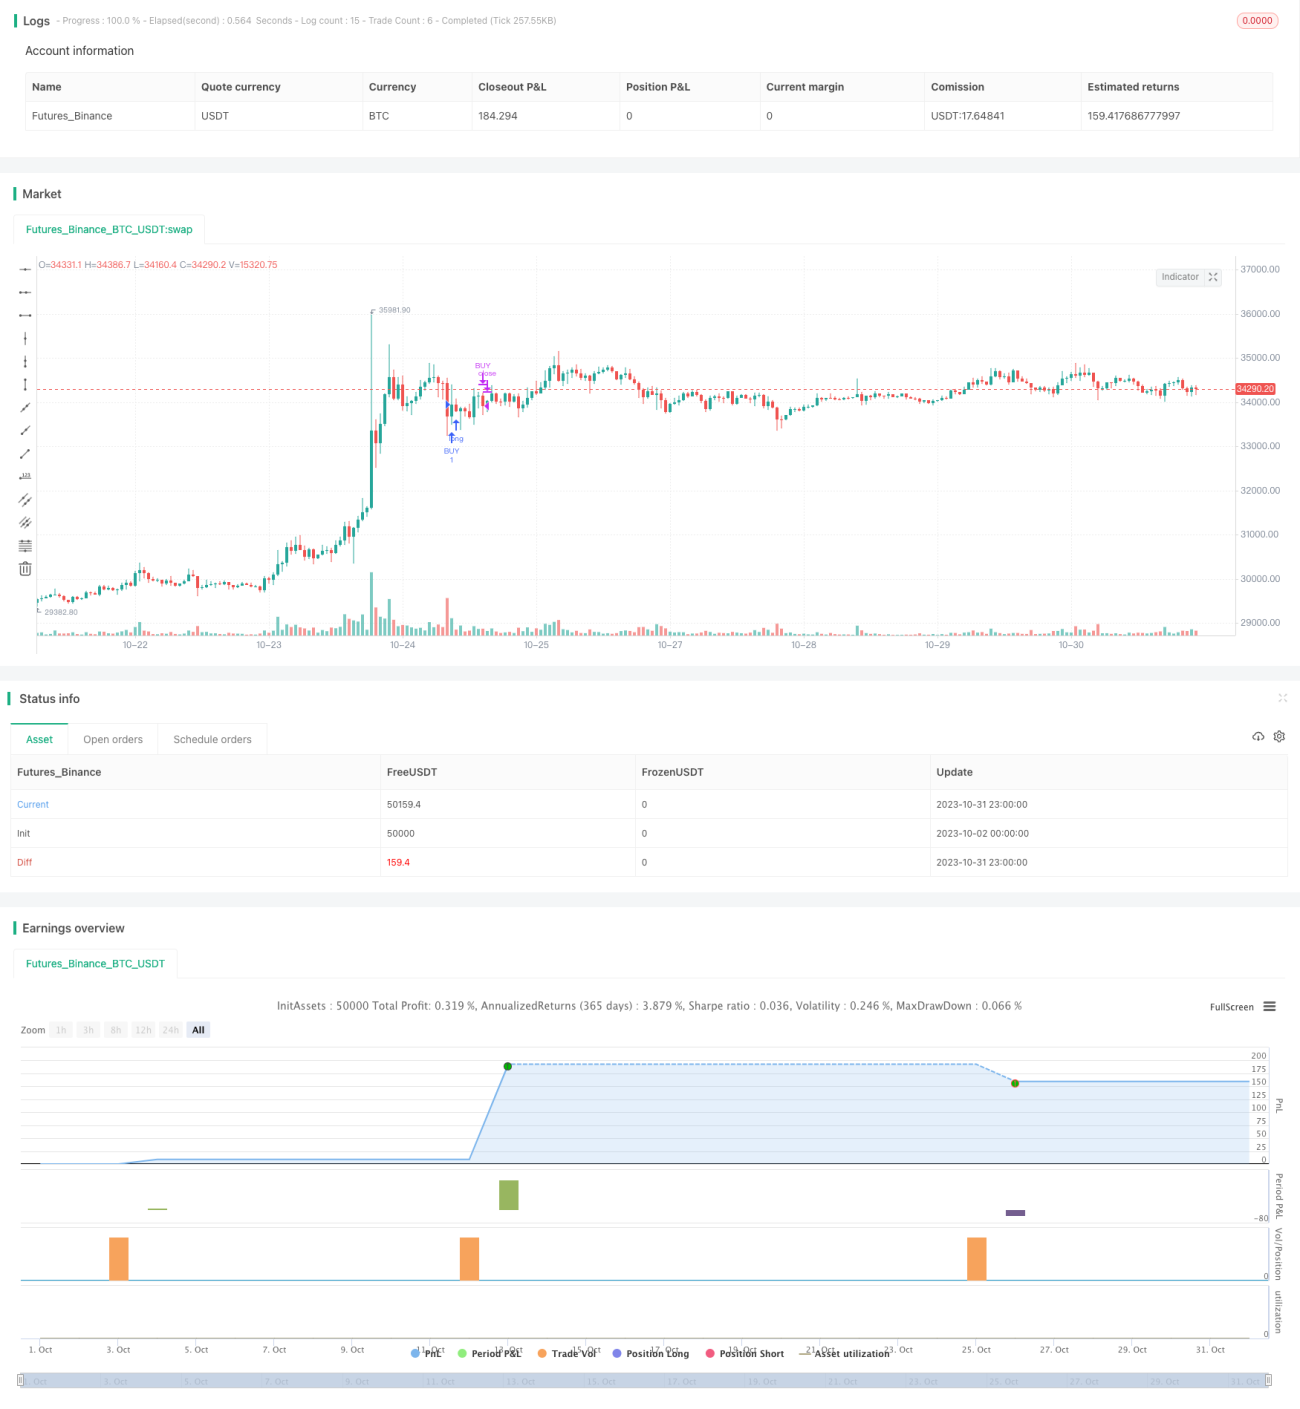
/*backtest
start: 2023-10-02 00:00:00
end: 2023-11-01 00:00:00
period: 1h
basePeriod: 15m
exchanges: [{"eid":"Futures_Binance","currency":"BTC_USDT"}]
*/

// This source code is subject to the terms of the Mozilla Public License 2.0 at https://mozilla.org/MPL/2.0/
// © TraderHalai
// This script was born out of my quest to be able to display strategy back test statistics on charts to allow for easier backtesting on devices that do not natively support backtest engine (such as mobile phones, when I am backtesting from away from my computer). There are already a few good ones on TradingView, but most / many are too complicated for my needs.
//- 1