Trend Following SMA Strategy

Overview
The Trend Following SMA strategy uses a combination of simple moving average (SMA) and fast SMA to determine market trend direction and generate trading signals. It goes long when price crosses above SMA and FSMA and exits long when price crosses below. It goes short when price crosses below SMA and FSMA and exits short when price crosses above. The strategy provides dynamic no-curve-fitting trading signals to capture trend changes.
Strategy Logic
The strategy uses sma function to calculate 50-period SMA and fast SMA fsma. fsma is calculated based on SMA plus 6 times standard deviation of price over n periods.
Two boolean variables long and short are used to record long and short positions. long is set to 1 when price crosses above sma and fsma for long entry, and -1 when price crosses below for exit. short follows the similar logic for short position.
The trend variable is used for trend determination. It is set to 1 when price is above fsma and sma for uptrend, and -1 when price is below fsma and sma for downtrend.
Trading signals of long and short are generated based on realtime trend direction. When trend changes from down to up, if price is above fsma, go long. When trend changes from up to down, if price is below sma, go short.
The strategy combines both trend following and breakout methods to capture opportunities when trend changes.
Advantages
-
Using double confirmation of two MAs filters fake breakouts.
-
Combining trend following and breakout catches turning points.
-
No curve fitting or optimization for dynamic trading signals.
-
Simple and clear logic, easy to understand and modify.
-
Customizable parameters for length, multiplier for different markets.
Risks
-
Double MA crosses may cause excessive whipsaw trades and reversals.
-
MA lag may miss early trend reversal.
-
No stop loss mechanism to control single trade loss.
-
Improper parameter tuning leads to overtrading or lagging.
-
For Risk 1 and 2, lengthen MA periods, add drawdown stop loss.
-
For Risk 3, add percentage or order stop loss.
-
For Risk 4, adjust parameters dynamically for different markets.
Enhancement
-
Add trend filter using MACD, DMI to confirm trend.
-
Use KD, RSI to trade mean-reversion overbought/oversold.
-
Add overall stop loss such as trailing stop, percentage stop.
-
Add position sizing module for dynamic adjustment.
-
Optimize parameters to adapt across timeframes.
-
Introduce machine learning for auto parameter tuning.
-
Build composite strategy with additional filters.
-
Utilize deep learning to detect complex trend patterns.
Conclusion
The SMA trend following strategy is a simple trend trading system. It uses fast and slow MAs to assist trend direction and capture trend reversal. However, risks like whipsaw and lag exist. Future enhancements include adding filters, stops, dynamic parameters etc. Overall it serves as a good starter trend following strategy, but optimizations are needed for real-world applications to maximize its performance.
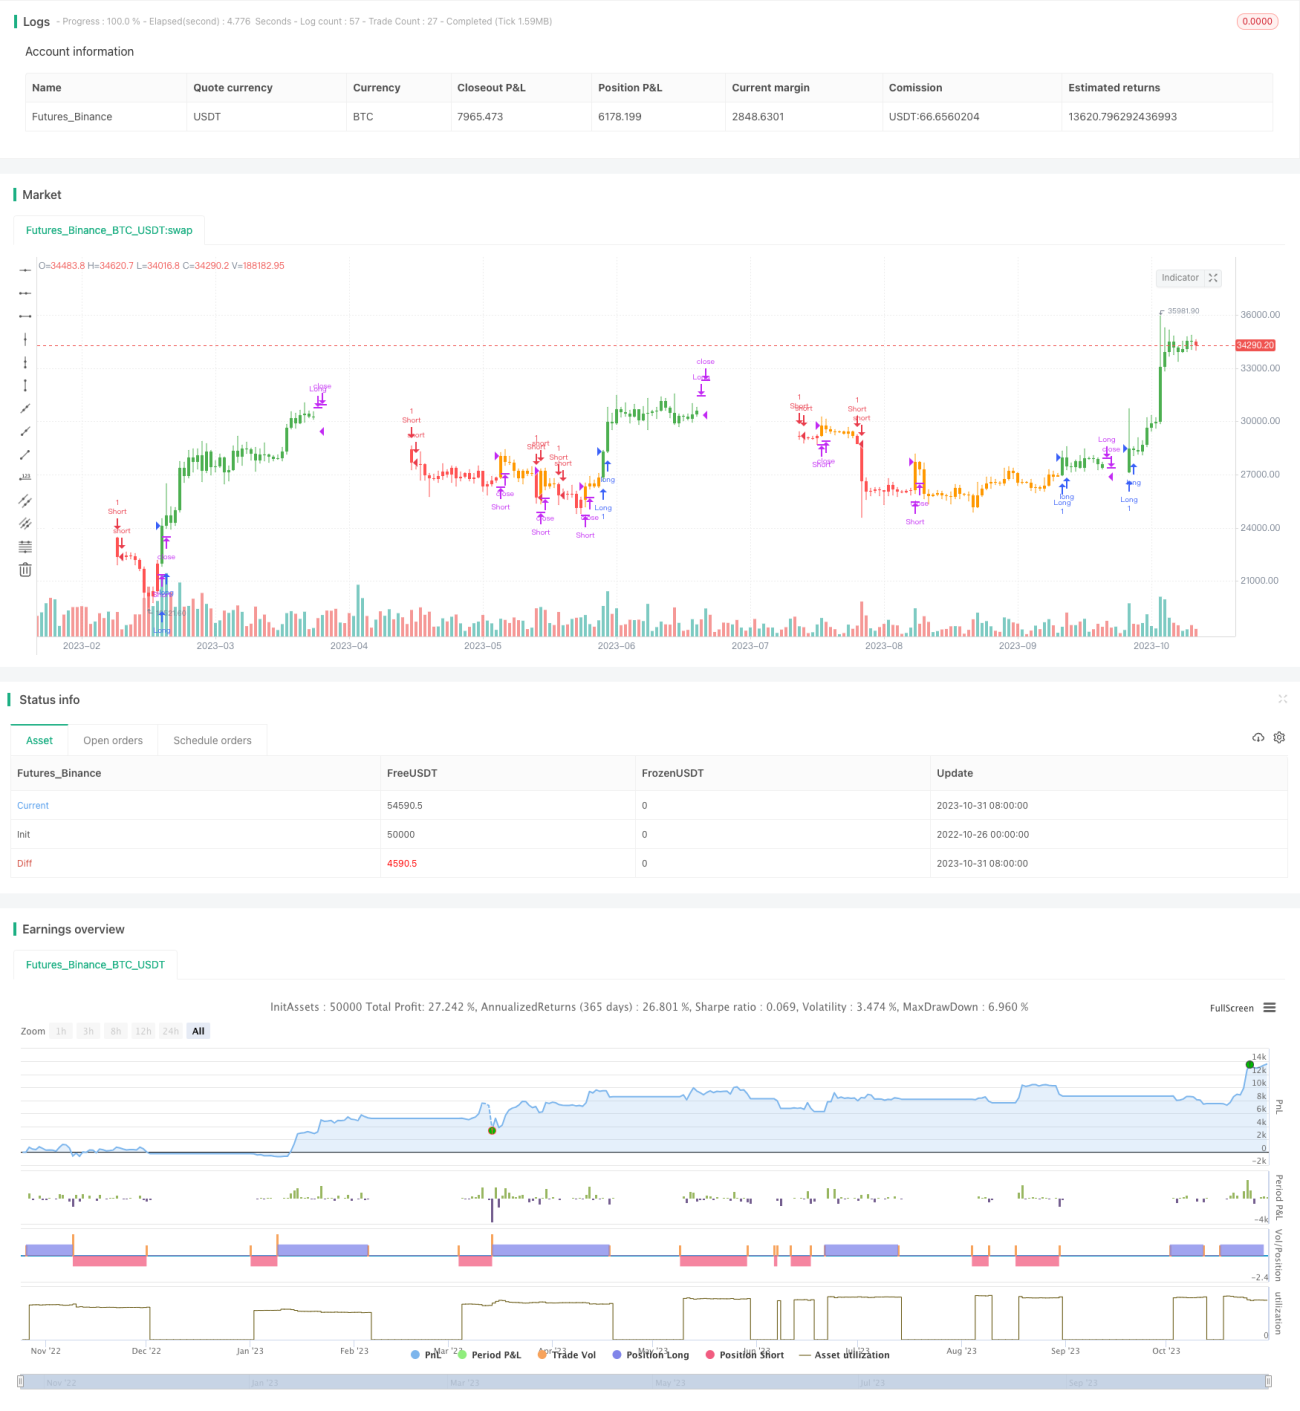
/*backtest
start: 2022-10-26 00:00:00
end: 2023-11-01 00:00:00
period: 1d
basePeriod: 1h
exchanges: [{"eid":"Futures_Binance","currency":"BTC_USDT"}]
*/

//@version=4
strategy("SMA STRATEGY", shorttitle="SMA TREND", overlay=true, calc_on_order_fills=true)
length = input(title="Length", type=input.integer, defval=50)
src_=input(close, title="Source", type=input.source)- 1