Dual Signal Trend Tracking Strategy

Overview
This strategy combines dual EMA and Awesome Oscillator indicators to identify and track trends. EMA quickly judges short-term trend direction while Awesome Oscillator filters out false breakouts and provides entry timing. The strategy name "Dual Signal Trend Tracking Strategy" accurately summarizes its main functionality.
Strategy Logic
This strategy mainly utilizes two technical indicators, dual EMA and Awesome Oscillator, to filter signals with the following logic:
-
Calculate 2-period and 20-period EMA. When 2-period EMA breaks 20-period EMA upward, it signals an uptrend. When 2-period EMA breaks 20-period EMA downward, it signals a downtrend.
-
Calculate Awesome Oscillator, which is MACD histogram smoothed by fast EMA minus slow EMA. When AO histogram changes from red to blue, it is a buy signal. When it changes from blue to red, it is a sell signal.
-
Only when EMA shows uptrend and AO shows a buy signal at the same time, a final buy signal is generated. Only when EMA shows downtrend and AO shows a sell signal, a final sell signal is generated.
-
Through this dual signal filtering mechanism, false breakouts can be reduced and mid-term trends can be tracked.
Advantage Analysis
The advantages of this strategy are:
-
Dual line filtering reduces noisy trades caused by errors. EMA judges overall trend while AO filters entry timing. Combining the two improves signal reliability.
-
Extremely fast response sensitivity quickly captures short-term reversals. 2-period EMA is very sensitive to breakouts and can quickly determine if recent trends have changed.
-
Awesome Oscillator further filters MACD to effectively identify false breakouts in trends and avoid unnecessary reverse trades.
-
The strategy has a clear direction to track mid-term trends. EMA determines the basic trend while AO filters signals to ensure trading along overall trends.
-
Reasonable parameter selection. 2-period and 20-period EMA capture price changes over different timeframes. AO parameters 5 and 34 are optimized to identify short-term patterns.
Risk Analysis
Some risks also exist:
-
In ranging markets, EMA and AO may generate more false signals, causing unnecessary short trades. Adjusting EMA period can reduce errors.
-
AO may sometimes lag EMA, causing signal time delays. AO parameters can be optimized for faster response.
-
EMA and AO combing short and mid-term features require quality data and computing power. Parameters should be adjusted for different products.
-
Frequent trading leads to higher commissions and slippage costs. Exit criteria can be relaxed to extend holding periods.
-
The strategy does not consider long-term trends and key support/resistance levels. More factors should be combined to ensure correct trade direction.
Optimization Directions
The strategy can be optimized through several aspects:
-
Introduce trend indicators like moving average ribbons and ATR to assist EMA in determining overall trend.
-
Add key support/resistance detection like Fibonacci retracements, generating signals only around key levels to avoid bad entry positions.
-
Optimize EMA and AO parameter combinations to improve combo effects. For example, use genetic algorithms to find optimal parameter pairs.
-
Add stop loss exits. Exit when price breaks recent Swing High/Low to control single trade loss.
-
Backtest on historical data to evaluate strategy performance, check if stable profitability meets expectations.
-
Paper trade to gradually adjust parameters and improve live performance. Test parameter robustness to find better stable parameter sets.
Conclusion
The overall strategy idea is clear, combining EMA for overall trend and AO for signal filtering. It can effectively identify and track trends but also has some risks and limitations for further optimization and testing to improve stability. The key is choosing suitable products and parameters combined with proper trading principles and styles. Overall this strategy has sound logic and practical value.
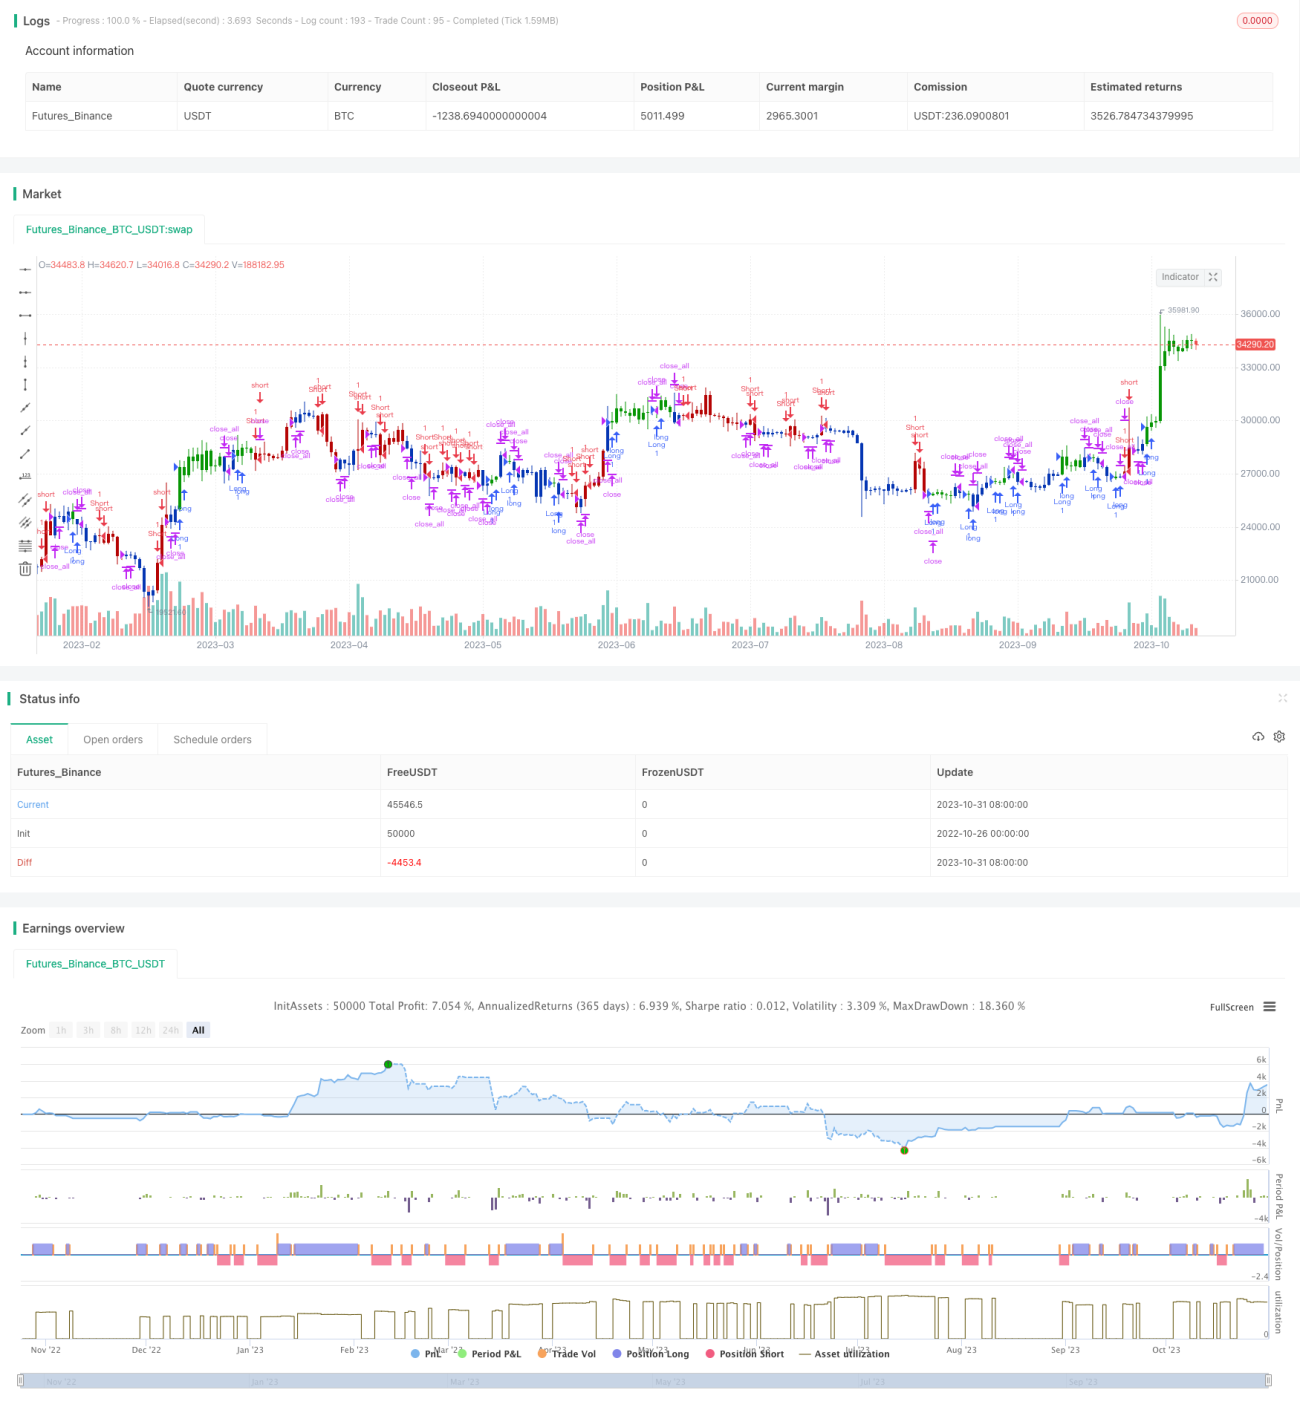
/*backtest
start: 2022-10-26 00:00:00
end: 2023-11-01 00:00:00
period: 1d
basePeriod: 1h
exchanges: [{"eid":"Futures_Binance","currency":"BTC_USDT"}]
*/

//@version=5
////////////////////////////////////////////////////////////
//  Copyright by HPotter v1.0 27/04/2022
// This is combo strategies for get a cumulative signal. - 1