Bull and Bear Balance Strategy

Overview
The Bull and Bear Balance Strategy is an improved trend following strategy. It analyzes the balance between bullish and bearish forces based on the relationship between the current bar and previous bar, and generates trading signals when the balance is broken. The idea comes from the traditional Elder Ray indicator but with improvements to judge trends more accurately.
Strategy Logic
The core indicator of this strategy is nBBB, which reflects the balance between bullish and bearish forces of the current bar versus the previous bar. The nBBB is calculated as:
nBBB = value2 - value
Where value and value2 calculate the bullish and bearish forces of the current bar and previous bar respectively. The calculation is quite complex, involving judgments on the relationship between close, open, high and low prices. But in general, value measures the bull/bear forces of the current bar, and value2 measures that of the previous bar. Their difference reflects the change in bull/bear balance.
When nBBB falls below the threshold SellLevel, a short signal is generated. When nBBB rises above the threshold BuyLevel, a long signal is generated. The thresholds can be adjusted through parameters.
Advantages
The main advantages of this strategy are:
-
Based on reversal signals from candlesticks, it can identify strong trend turning points.
-
By measuring bull/bear balance, the signals are more accurate and reliable.
-
Comparing current bar with previous bar filters out some noise for clearer signals.
-
Applicable to different timeframes with good flexibility.
-
The nBBB indicator is intuitive and signals are simple and clear.
Risks
Some risks to note:
-
nBBB may generate false signals, requiring price confirmation.
-
Relying solely on nBBB has blind spots, better to incorporate other indicators.
-
SellLevel and BuyLevel parameters directly impact performance and need careful optimization.
-
Signals may lag during extreme volatility, requiring risk assessment.
-
More suitable for mid/long-term, short-term may get whipsawed.
Enhancements
Some ways to enhance the strategy:
-
Optimize SellLevel and BuyLevel based on historical backtests for best fit.
-
Incorporate stop loss mechanisms like trailing stop loss to control risks.
-
Add other indicators like volume, stochastic etc. to improve decision accuracy.
-
Introduce machine learning to auto-optimize parameters and generate better signals.
-
Separate parameter optimization for different products and timeframes.
Conclusion
The Bull and Bear Balance Strategy judges trend reversals by measuring changes in bull/bear force, making it a relatively simple and practical trend following strategy. It has certain advantages but also risks. With parameter optimization, stop losses, additional indicators etc., it can be improved further. Overall it presents an interesting quantitative approach worth deeper research and application.
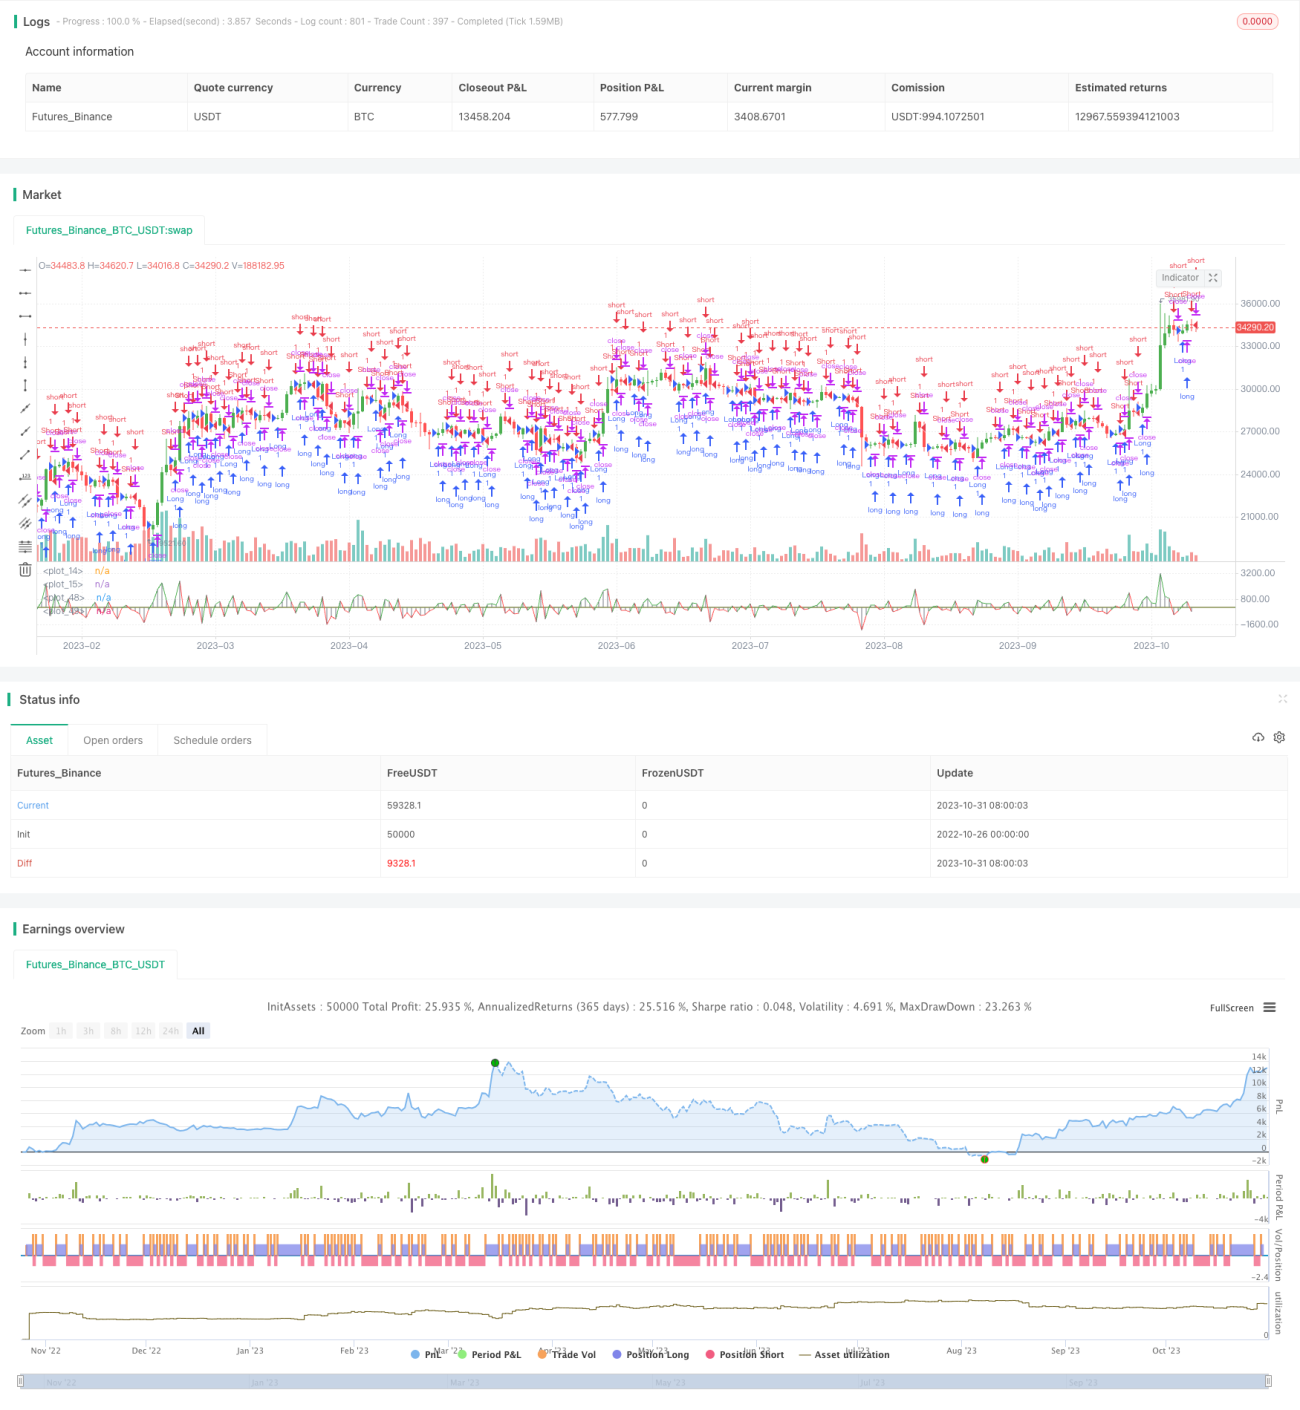
/*backtest
start: 2022-10-26 00:00:00
end: 2023-11-01 00:00:00
period: 1d
basePeriod: 1h
exchanges: [{"eid":"Futures_Binance","currency":"BTC_USDT"}]
*/

//@version=2
////////////////////////////////////////////////////////////
//  Copyright by HPotter v1.0 03/02/2017
// This new indicator analyzes the balance between bullish and- 1