Relative Momentum Index Strategy

Overview
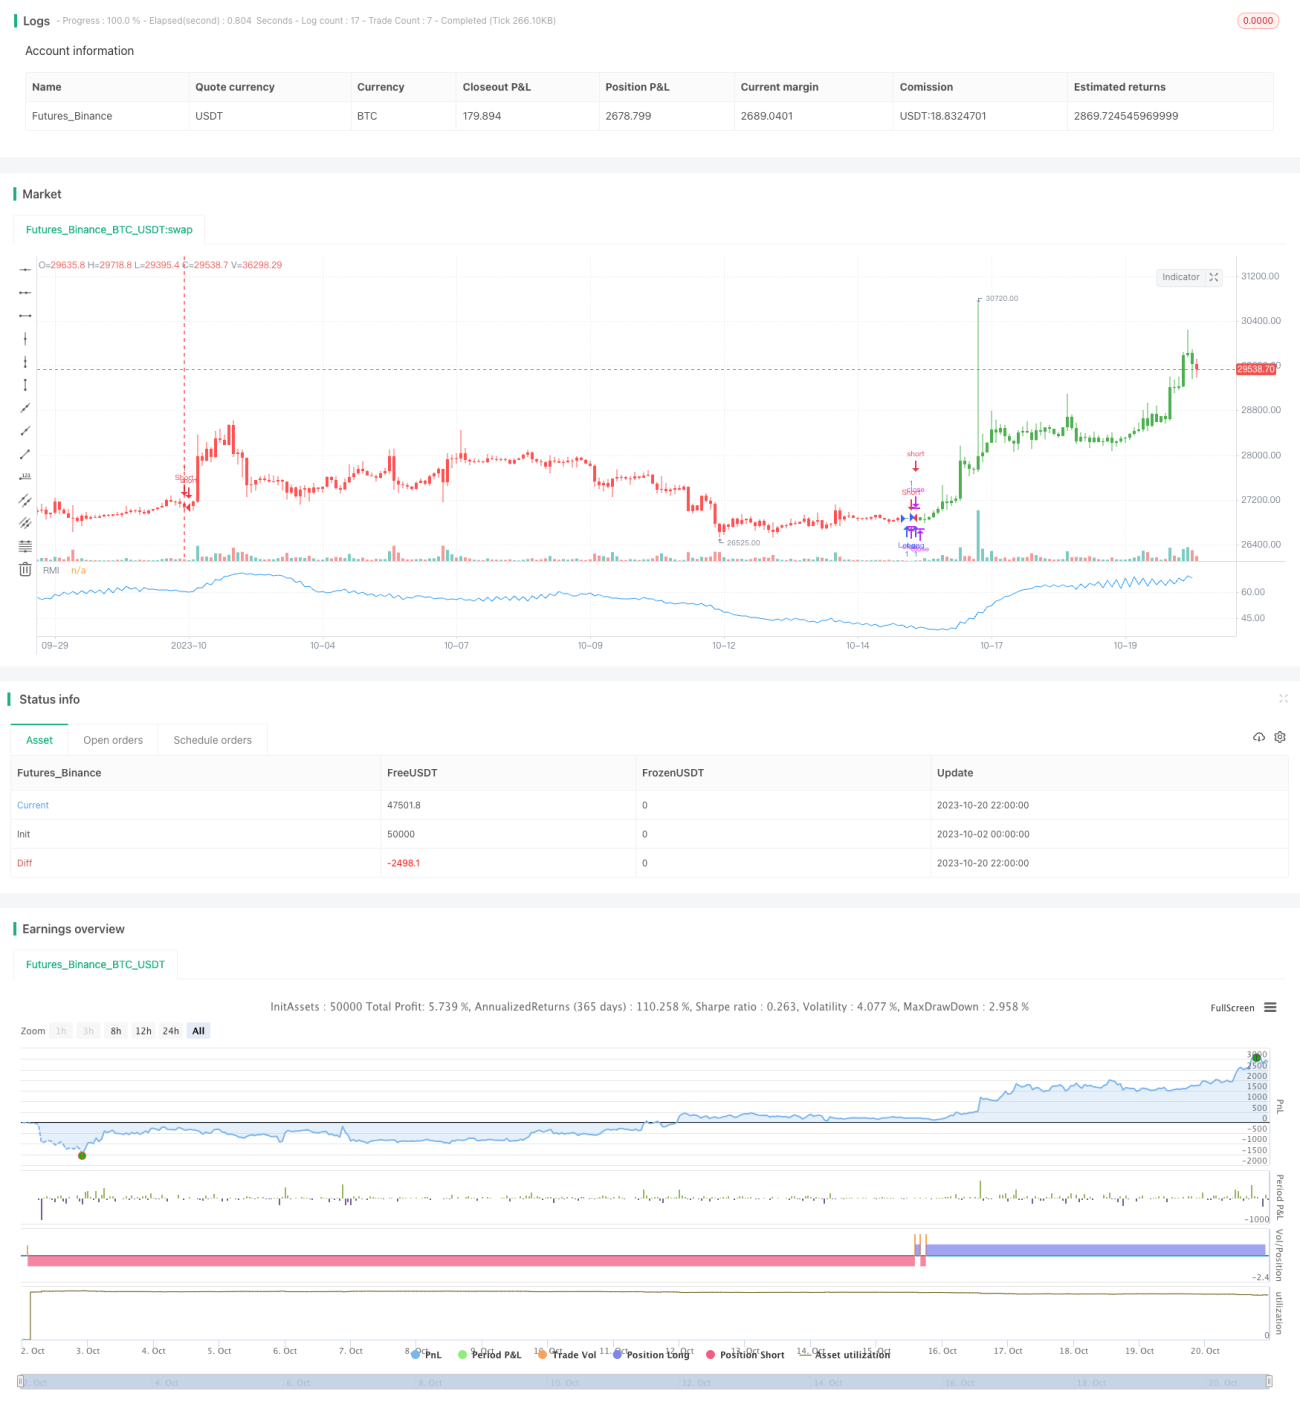
The Relative Momentum Index (RMI) strategy is an improved version based on the momentum index. It calculates price momentum over a period to determine if the market is overbought or oversold, in order to capture reversal opportunities.
Strategy Logic
The RMI calculation formula is as follows:
cpp
xMom = xPrice - xPrice[Length] // Price change over Length periods
xMU = If xMom >= 0: previous xMU minus xMU/Length plus xMom; else: previous xMU
xMD = If xMom <= 0: previous xMD minus xMD/Length plus absolute value of xMom; else: 0
RM = xMU / xMD
RMI = 100 * (RM / (1 + RM))
First calculate the price change xMom over Length periods. If xMom>=0, meaning price rises, accumulate it into xMU; if xMom<0, meaning price drops, accumulate its absolute value into xMD. RM is the ratio between xMU and xMD, representing the momentum of ups and downs. RMI normalizes RM into the range of 0-100.
When RMI is higher than the threshold SellZone, the market is overbought, go short. When RMI is lower than BuyZone, the market is oversold, go long.
Advantages
- Compared to RSI, RMI is more sensitive and can capture reversal opportunities earlier.
- RMI measures the momentum of ups and downs, less affected by consolidation.
- Based on momentum, RMI can better determine overbought/oversold status.
Risks
- Like other reversal strategies, RMI has the risk of being stopped out by strong trends. Long signals may get breached.
- RMI parameters need to be optimized for different products, otherwise the results may be poor.
- Overbought/oversold thresholds need to be set reasonably, otherwise too many false signals may occur.
Risks can be reduced by widening stop loss, optimizing parameters, combining with trend strategies etc.
Improvement
RMI strategy can be improved from the following aspects:
- Optimize Length parameter to maximize return.
- Optimize overbought/oversold thresholds to reduce false signals.
- Add stop loss to control single loss.
- Combine with trend following or moving average strategies to increase winning rate.
- Select appropriate trading sessions based on product characteristics to improve stability.
Conclusion
RMI strategy captures short-term pullback opportunities by measuring price momentum change. Compared to RSI, RMI is more sensitive and robust to consolidation. But risks of being stopped out exist. Parameters need to be optimized and combined with trend strategies to maximize performance.
/*backtest
start: 2023-10-02 00:00:00
end: 2023-10-21 00:00:00
period: 2h
basePeriod: 15m
exchanges: [{"eid":"Futures_Binance","currency":"BTC_USDT"}]
*/

//@version=2
////////////////////////////////////////////////////////////
//  Copyright by HPotter v1.0 19/10/2017
// The Relative Momentum Index (RMI) was developed by Roger Altman. Impressed - 1