EMA 13 48 Trend Following Strategy

Overview
This strategy generates trading signals based on the 13-period and 48-period exponential moving average (EMA) lines, belonging to the dual EMA crossover system trend following strategy. It goes long when the short period EMA crosses over the long period EMA, and closes position when the short period EMA crosses below the long period EMA. By capturing longer cycle trends and avoiding being misled by short-term market fluctuations, this strategy aims to achieve steady profits.
Strategy Logic
This strategy uses 13-period EMA as the short period EMA, and 48-period EMA as the long period EMA. Assume the short period EMA is the fast line, and the long period EMA is the slow line.
When the fast line crosses over the slow line from below, a buy signal is generated. This indicates the short-term trend starts to strengthen versus the long-term trend, implying the uptrend is strengthening, thus going long accordingly.
When the fast line crosses below the slow line from above, a close position signal is generated. This indicates the short-term trend starts to weaken versus the long-term trend, implying the uptrend is weakening, thus closing long position to stop loss.
Through such crossover operations, this strategy can trend-follow, cut loss in time, avoiding unnecessary losses caused by misinterpreting short-term fluctuations as trend reversal.
Advantages
-
Captures long cycle trends, avoids being misguided by short-term market noise. The 13 and 48 period parameters selection can smooth price data and identify longer trend direction.
-
Strong drawdown control capability. It can cut loss quickly when short-term trend weakens, effectively controlling losses.
-
Simple to implement, clear logic. Dual EMA cross is a common trend strategy, easy to understand and master.
-
High extendability. Other assist indicators can be introduced for further optimization.
Risks
-
May generate excessive invalid trading signals when short-term price oscillates frequently.
-
Poor trend identification capability when EMA parameters are set inappropriately, possibly capturing wrong direction.
-
Unable to determine trend strength, may chase new highs and cause losses in later trend stages.
-
Entry position unclear, subsequent adjustment risk exists.
Optimization Directions
-
Introduce assist indicators to determine trend strength, avoid chasing highs. Such as volume, volatility indicators etc.
-
Optimize EMA parameters to better suit different products' characteristics.
-
Add stop loss methods like moving stop loss, percentage stop loss to reduce risk.
-
Add filter conditions to avoid invalid trades in trend oscillations. Such as using DMI, KDJ to determine trend status.
-
Combine other entry indicators to determine precise entry point. Such as MACD signal to clarify specific buy/sell timing.
Summary
This strategy identifies longer cycle trend directions through the crossover system formed by 13-period and 48-period EMAs, trend-following accordingly and cutting loss before trend ends. It is a simple and practical trend following strategy. But risks like capturing wrong directions and chasing tops still exist. Improvements can be made by introducing assist indicators, optimizing parameters, adding stop loss methods etc, to make the strategy more stable and reliable.
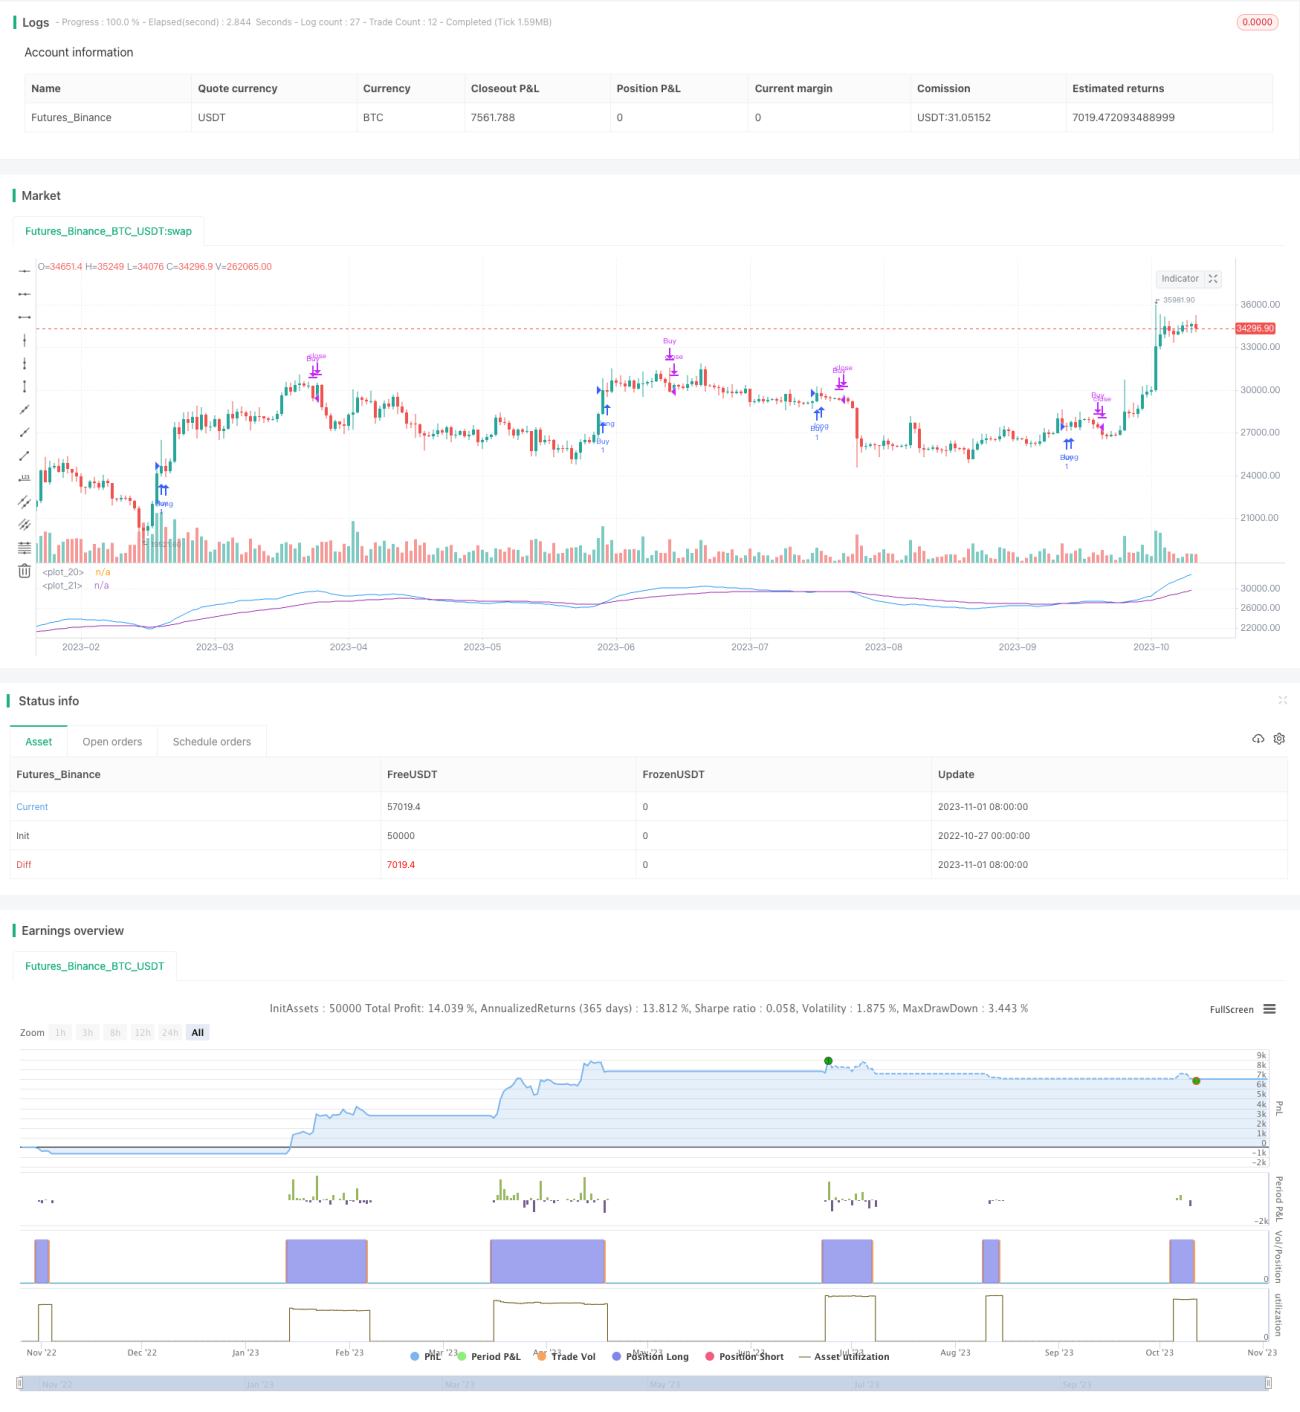
/*backtest
start: 2022-10-27 00:00:00
end: 2023-11-02 00:00:00
period: 1d
basePeriod: 1h
exchanges: [{"eid":"Futures_Binance","currency":"BTC_USDT"}]
*/

//@version=3

// strategy("EMA Strategy 13 48", shorttitle = "EMA Strategy 13 48", overlay=true, pyramiding = 3,default_qty_type = strategy.percent_of_equity, default_qty_value = 1000)
- 1