RSI-BB Momentum Breakout Strategy

Overview
The RSI-BB momentum breakout strategy combines the Relative Strength Index (RSI) and Bollinger Bands (BB) indicators for breakout trading. It uses RSI to determine market trends and overbought/oversold levels, and BB to identify breakout points. When both RSI and BB signals align, the strategy will enter long or short trades accordingly.
Strategy Logic
The code first computes the RSI and BB indicators.
The RSI is calculated as:
pine
up = rma(max(change(close), 0), 30)
down = rma(-min(change(close), 0), 30)
rsi = down == 0 ? 100 : up == 0 ? 0 : 100 - (100 / (1 + up / down))
Where up measures the upward price movement over 30 periods, down measures the downward price movement, and rsi is computed based on the ratio of up to down.
The BB is calculated as:
            pine

            basis = sma(close, 50)
dev = 0.2 * stdev(close, 50)
upper = basis + dev
lower = basis - dev
Where basis is the 50-period moving average, dev is 0.2 times the standard deviation, upper and lower are the bands.
bbi is the bollinger bandwidth index, computed as:
            pine

            bbr = close>upper? 1 : close<lower? -1 : 0
bbi = bbr - bbr[1]
bbr checks if close breaks upper or lower band. Breakout is 1, breakdown is -1, otherwise 0. bbi is the difference between current and previous bbr. Positive bbi indicates upward breakout, negative indicates downward.
The strategy signals are determined as:
            cpp

            long = rsi>52 and rsi<65 and bbi>0.11 and bbi<0.7
short = rsi<48 and rsi>35 and bbi<-0.11 and bbi>-0.7
Go long when RSI is between 52-65 and BBI is between 0.11 and 0.7. Go short when RSI is between 35-48 and BBI is between -0.11 and -0.7.
Advantages
-
Combining RSI and BB provides more reliable signals. RSI gauges trend and overbought/oversold levels, BB identifies breakout.
-
30-period RSI filters out some market noise and focuses on major trends.
-
50-period BB with 0.2 standard deviation helps filter out whipsaws.
-
BBI thresholds filter fake breakouts.
-
RSI long/short zones of 52-65 and 35-48 provide some buffer to avoid missed trades.
Risks
-
Breakout strategies are prone to being caught in whipsaws, need to manage risk with stop loss.
-
Backtest results may be overfitted, live performance may vary.
-
Extreme market moves may hit stop loss resulting in large losses.
-
RSI and BB parameters including periods and thresholds need to be optimized.
-
Order price can significantly impact live performance.
Enhancement Opportunities
-
Test different combinations of RSI and BB parameters to find optimal settings.
-
Add other indicators like MACD, KD for signal filtration.
-
Optimize RSI long/short zones to filter out more noise.
-
Optimize dynamic BBI thresholds to better filter fakeouts.
-
Add trend filter to avoid trading against major trend.
-
Test different stop loss techniques to find optimal risk control.
-
Test different order types to minimize slippage impact.
Conclusion
The RSI-BB strategy combines the advantages of using trend and momentum indicators. Backtest results are promising but live performance may vary due to real-world factors like slippage and stop loss. Parameters and filters need to be optimized based on backtest results. Stop loss and order placement should also be evaluated for real-world effectiveness. The strategy has merit but requires ongoing enhancements and robustness testing to generate consistent results.
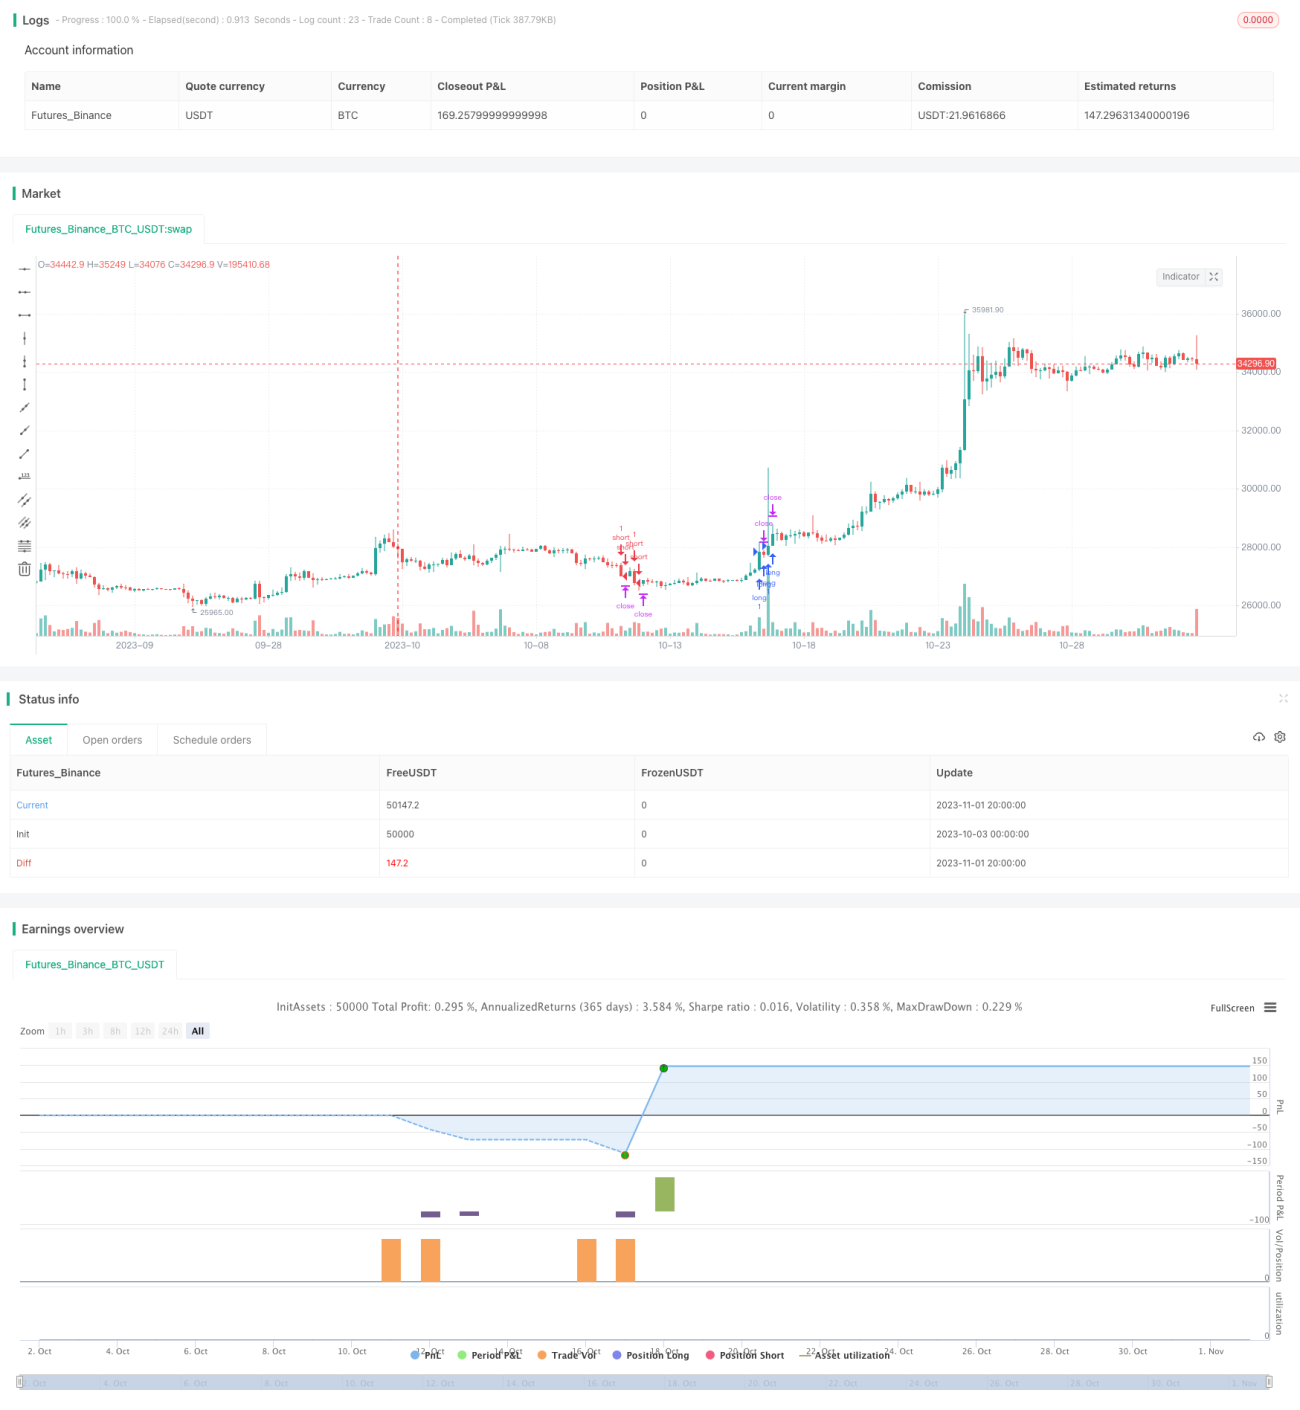
/*backtest
start: 2023-10-03 00:00:00
end: 2023-11-02 00:00:00
period: 4h
basePeriod: 15m
exchanges: [{"eid":"Futures_Binance","currency":"BTC_USDT"}]
*/

//@version=4
//Based on Larry Connors RSI-2 Strategy - Lower RSI
strategy(title="Spyfrat Strat", shorttitle="SpyfratStrat", overlay=true)
src = close, - 1