Volume Oscillator Based Trend Tracking Strategy

Overview
The volume oscillator based trend tracking strategy judges the current trend direction by calculating the ratio of positive and negative trading volume, and implements trend trading. Inspired by the On-Balance Volume (OBV) indicator, it determines the positivity and negativity of trading volume based on the relationship between close and open prices, and then constructs an indicator using the N-day moving average. It goes long when the indicator crosses above the upper rail, and goes short when crossing below the lower rail.
Principles
The main steps of this strategy are:
-
Calculate positive/negative volume: If the closing price is higher than the opening price, the volume of that candlestick is positive. If the closing price is lower than the opening price, the volume is negative. If they are equal, the volume is 0.
-
Sum up the N-day positive/negative volume to get the accumulated volume.
-
Calculate the N-day moving average of the accumulated volume to get the final indicator value.
-
Go long when the indicator crosses above the upper rail, and go short when crossing below the lower rail.
By judging the trend direction through volume positivity/negativity and generating trading signals with moving averages, this strategy can effectively track trends and capture medium- to long-term moves.
Advantages
-
Using volume to determine trends is more convincing, as volume reflects market participation.
-
Smoothing with moving averages helps in trend tracking and reduces excessive trading.
-
The moving average period can be adjusted to fit different market rhythms.
-
The upper/lower rails provide clear long/short signals.
-
The logic is simple and easy to understand.
Risks
-
There is a risk of false signals. The strategy may also get stuck in range-bound markets.
-
Divergence may occur during huge market swings.
-
The static upper/lower rails cannot adapt to market volatility.
-
There is no stop loss, leading to excessive losses.
-
Moving averages lag and may miss trend turning points.
Enhancement
-
Combine with other indicators for confirmation to avoid false signals.
-
Compute upper/lower rails dynamically to adapt to volatility.
-
Add stop loss mechanisms to limit losses.
-
Adjust moving average type to match market rhythm.
-
Optimize moving average periods for better trend tracking.
-
Consider trailing stops on upper/lower rail breaks to lock in profits.
Conclusion
The volume oscillator strategy effectively tracks medium- to long-term trends by judging trends via volume positivity/negativity and generating signals with moving averages. Its advantage lies in accurate trend determination and alignment with most traders' long-term practices. However, some problems remain that require further enhancements to handle market complexity better. Overall, this simple and practical trend tracking approach caters well to the needs of most quant traders.
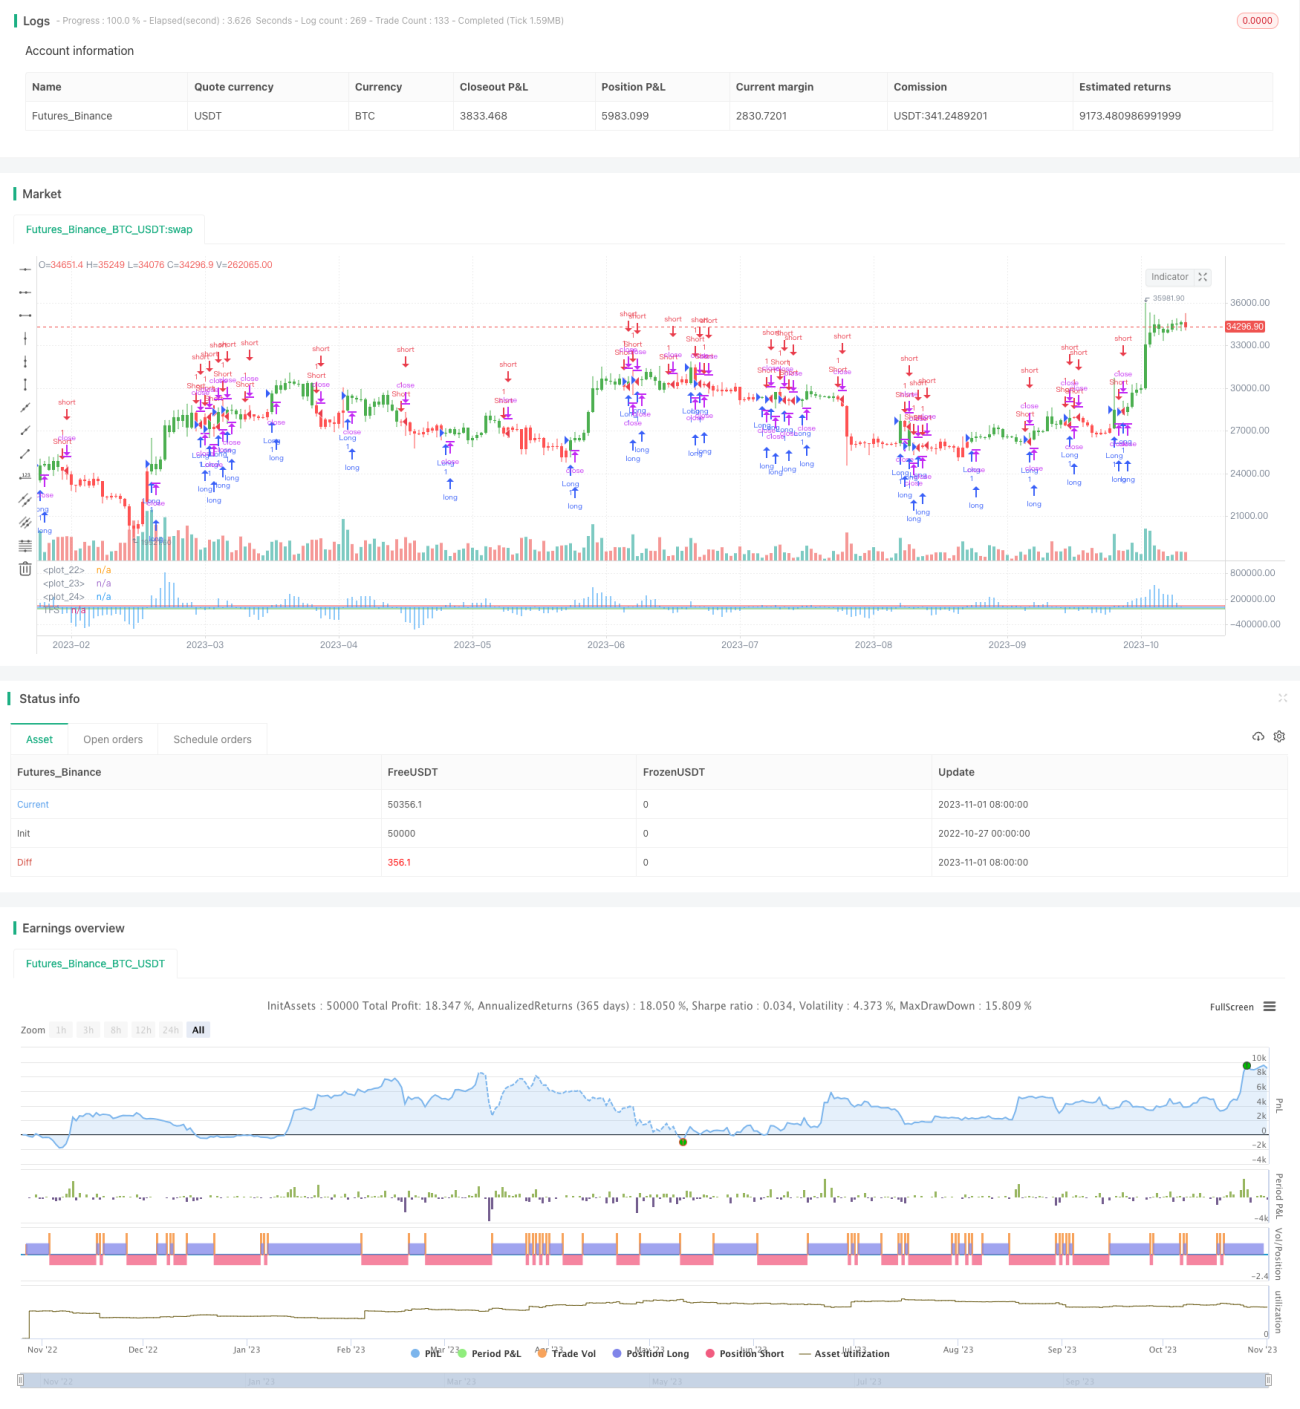
/*backtest
start: 2022-10-27 00:00:00
end: 2023-11-02 00:00:00
period: 1d
basePeriod: 1h
exchanges: [{"eid":"Futures_Binance","currency":"BTC_USDT"}]
*/

//@version=2
////////////////////////////////////////////////////////////
//  Copyright by HPotter v1.0 15/12/2017
// This is the second part of TFS trading strategy. The concept of this - 1