Jupiter and Saturn Momentum MA Crossover Filtered Strategy

Author: ChaoZhang, Date: 2023-11-03 16:13:20
Tags:

img

Overview

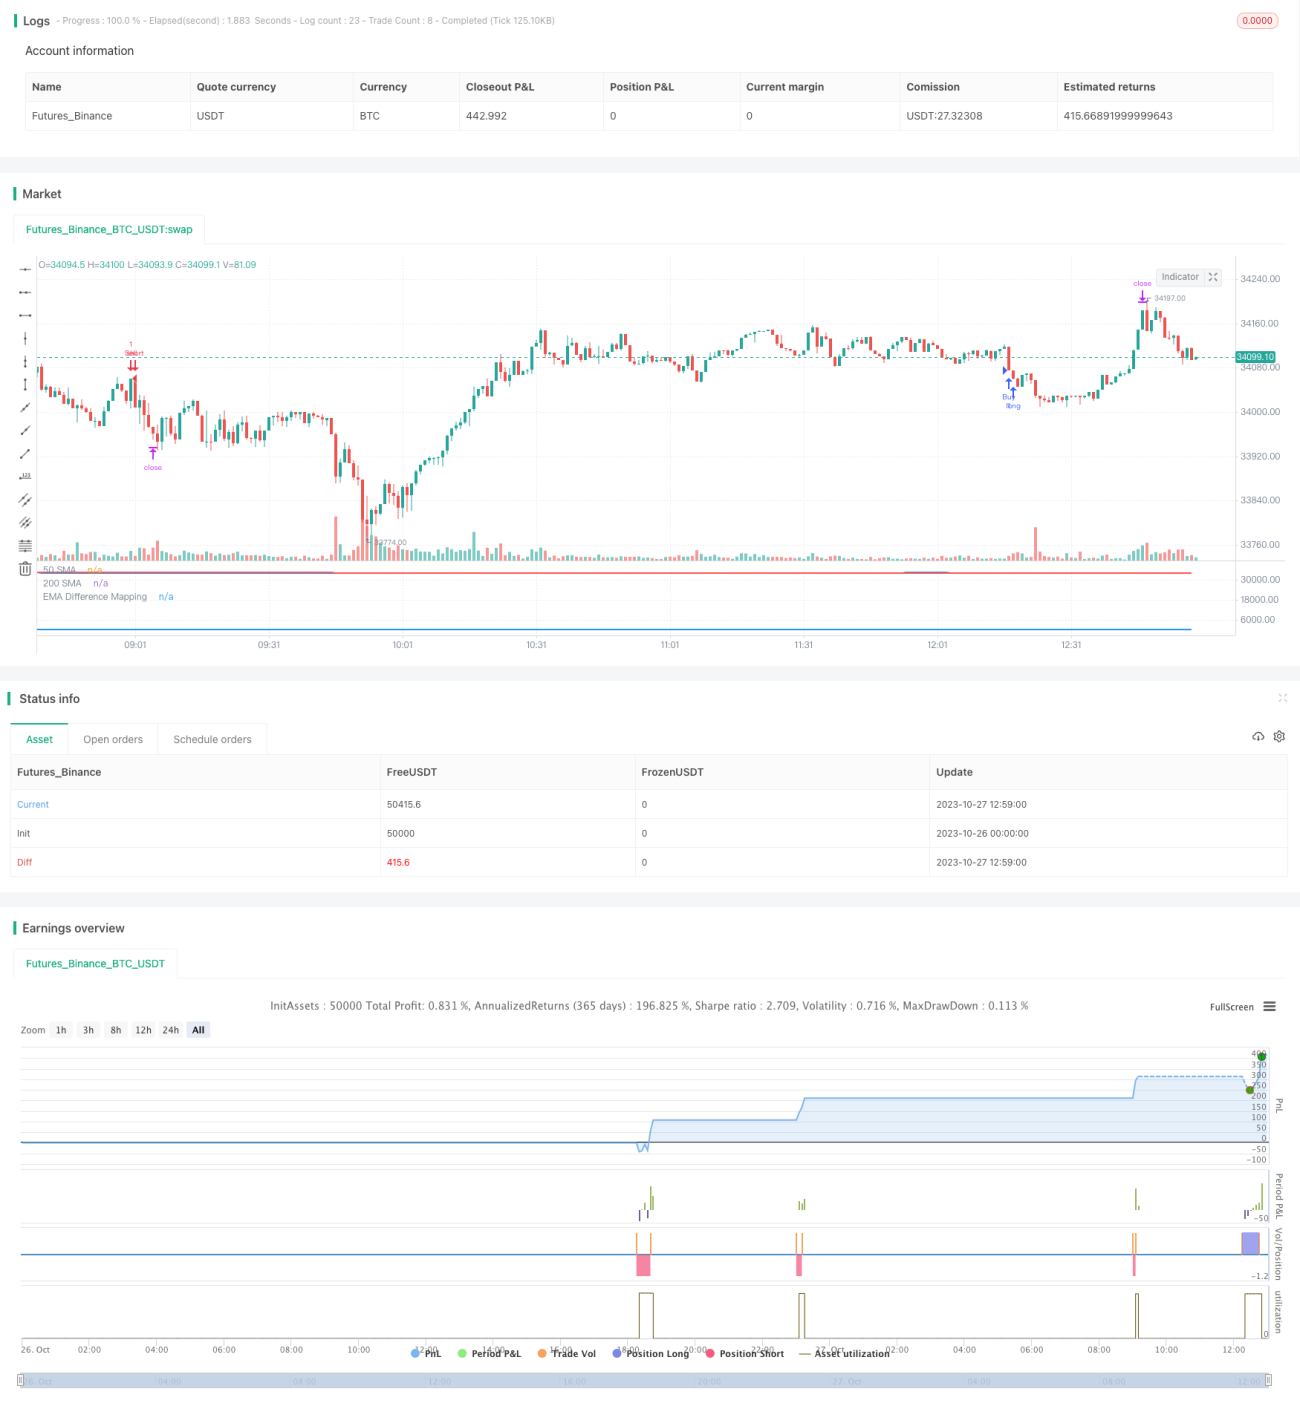
This strategy uses moving average crossovers as trading signals, combined with volatility indicator BB and a custom momentum indicator for filtration, aiming to improve the reliability of MA crossover signals and reduce false signals.

Principles

  1. Use 50-period EMA and 200-period SMA to form golden cross and death cross signals.

  2. When price is in an uptrend, require price to be above 200-day line and custom momentum indicator value below 25 to generate buy signals.

  3. When price is in a downtrend, require price to be below 200-day line and custom momentum indicator value above 75 to generate sell signals.

  4. Custom momentum indicator maps BB midline and band distance into 0-100 range based on historical maximums and minimums.

  5. Momentum indicator reflects relative price volatility, threshold filtering helps reduce false crossovers.

Advantages

  1. Utilize strengths of EMA and SMA to capture medium-long term trends.

  2. Increased filtration with momentum indicator improves reliability and reduces false signals.

  3. BB band distance reflects volatility intensity, historical normalization avoids parameter dependency.

  4. Customizable EMA, SMA periods and momentum threshold adaptable to varying market environments.

  5. Simple logic with optimization flexibility, strong practicality.

Risk Analysis

  1. EMA and SMA have lagging effect, may miss short-term opportunities.

  2. Trend following nature unsuitable for range-bound markets.

  3. Momentum threshold requires iterative backtesting for optimal parameter, risks overfitting.

  4. Longer-term systems offer steady but potentially limited absolute returns.

  5. Can shorten MA periods or add complementary indicators to improve adaptability.

Enhancement Opportunities

  1. Test different MA combinations for optimal parameters.

  2. Add complementary indicators like MACD, KD for additional validation.

  3. Optimize momentum indicator parameters like lookback period, mapping range.

  4. Incorporate stop loss to control risks.

  5. Adjust for symbol-specific parameters using machine learning feature extraction.

  6. Add volume indicators to avoid unreasonable crossover signals.

Conclusion

This strategy combines the strengths of long-term trend following and dual momentum threshold filtering for high reliability and practical value. Further improvements are possible through parameter optimization and complementary techniques. The innovative concept provides valuable insights for other trend systems. A valuable addition to the algorithmic trading strategy library.


/*backtest
start: 2023-10-26 00:00:00
end: 2023-10-27 13:00:00
period: 1m
basePeriod: 1m
exchanges: [{"eid":"Futures_Binance","currency":"BTC_USDT"}]
*/

//@version=4
strategy(title="EMA Difference Mapping with Trades", shorttitle="EMA Diff Map", overlay=false)

// Inputs
emaLength = input(20, "EMA Length")
stdDevLength = input(2, "Standard Deviation Length")
priceSource = close
takeProfitPoints = input(1000, title="Take Profit (in Points)")
stopLossPoints = input(2500, title="Stop Loss (in Points)")

// Calculate EMA
ema = ema(priceSource, emaLength)

// Calculate Standard Deviation
stdDev = stdev(priceSource, stdDevLength)

// Calculate differences
diff1 = (ema + stdDev) - ema
diff2 = ema - (ema - stdDev)

// Calculate min and max differences from last year
lookbackPeriod = 504 // Number of trading days in a year
minDiff1 = lowest(diff1, lookbackPeriod)
maxDiff1 = highest(diff1, lookbackPeriod)
minDiff2 = lowest(diff2, lookbackPeriod)
maxDiff2 = highest(diff2, lookbackPeriod)

// Map differences based on requirements
mappedDiff1 = 50 + 50 * ((diff1 - minDiff1) / (maxDiff1 - minDiff1))
mappedDiff2 = 50 - 50 * ((diff2 - minDiff2) / (maxDiff2 - minDiff2))

// Combine mapped differences into a single line
mappedLine = if close > ema
    mappedDiff1
else
    mappedDiff2

// Plot 'mappedLine' in the main chart area conditionally
plot(mappedLine, title="EMA Difference Mapping", color=(close > ema ? color.blue : na), style=plot.style_line, linewidth=2)

// Calculate the 50EMA and 200SMA
ema50 = ema(close, 50)
sma200 = sma(close, 200)

// Plot the 50EMA and 200SMA on the main chart
plot(ema50, color=color.blue, title="50 SMA", linewidth=2)
plot(sma200, color=color.red, title="200 SMA", linewidth=2)

// Initialize trade variables
var bool waitingForBuy = na
var bool waitingForSell = na
var bool buyConditionMet = false
var bool sellConditionMet = false

if not sellConditionMet and crossunder(ema50, sma200)
    sellConditionMet := true
    waitingForBuy := false

if sellConditionMet 
    waitingForSell := true
    sellConditionMet := false

if waitingForSell and close < sma200 and mappedLine > 75
    strategy.entry("Sell", strategy.short)
    strategy.exit("Sell Exit", "Sell", profit=takeProfitPoints, loss=stopLossPoints)
    waitingForSell := false

// Define the strategy conditions and execute trades
if not buyConditionMet  and crossover(ema50, sma200)
    buyConditionMet := true
    waitingForSell := false

if buyConditionMet 
    waitingForBuy := true
    buyConditionMet := false

if waitingForBuy and close > sma200 and mappedLine < 25
    strategy.entry("Buy", strategy.long)
    strategy.exit("Buy Exit", "Buy", profit=takeProfitPoints, loss=stopLossPoints)
    waitingForBuy := false


More