概述
该策略基于一目均衡表指标,结合止损单开发出的趋势跟踪策略。利用一目均衡表的转换线、基准线和延迟线这三条曲线构成的云带,判断价格趋势方向,并以云带上下边缘为止损位,设定止损单进行趋势跟踪。
策略原理
该策略主要基于以下原理:
一目均衡表中的转换线是过去9天的最高价和最低价的均值,反映最近期价格的平均变化。
基准线是过去26天的最高价和最低价的均值,反映中期价格的平均变化。
延迟线是过去52天的最高价和最低价的均值,反映长期价格的平均变化。
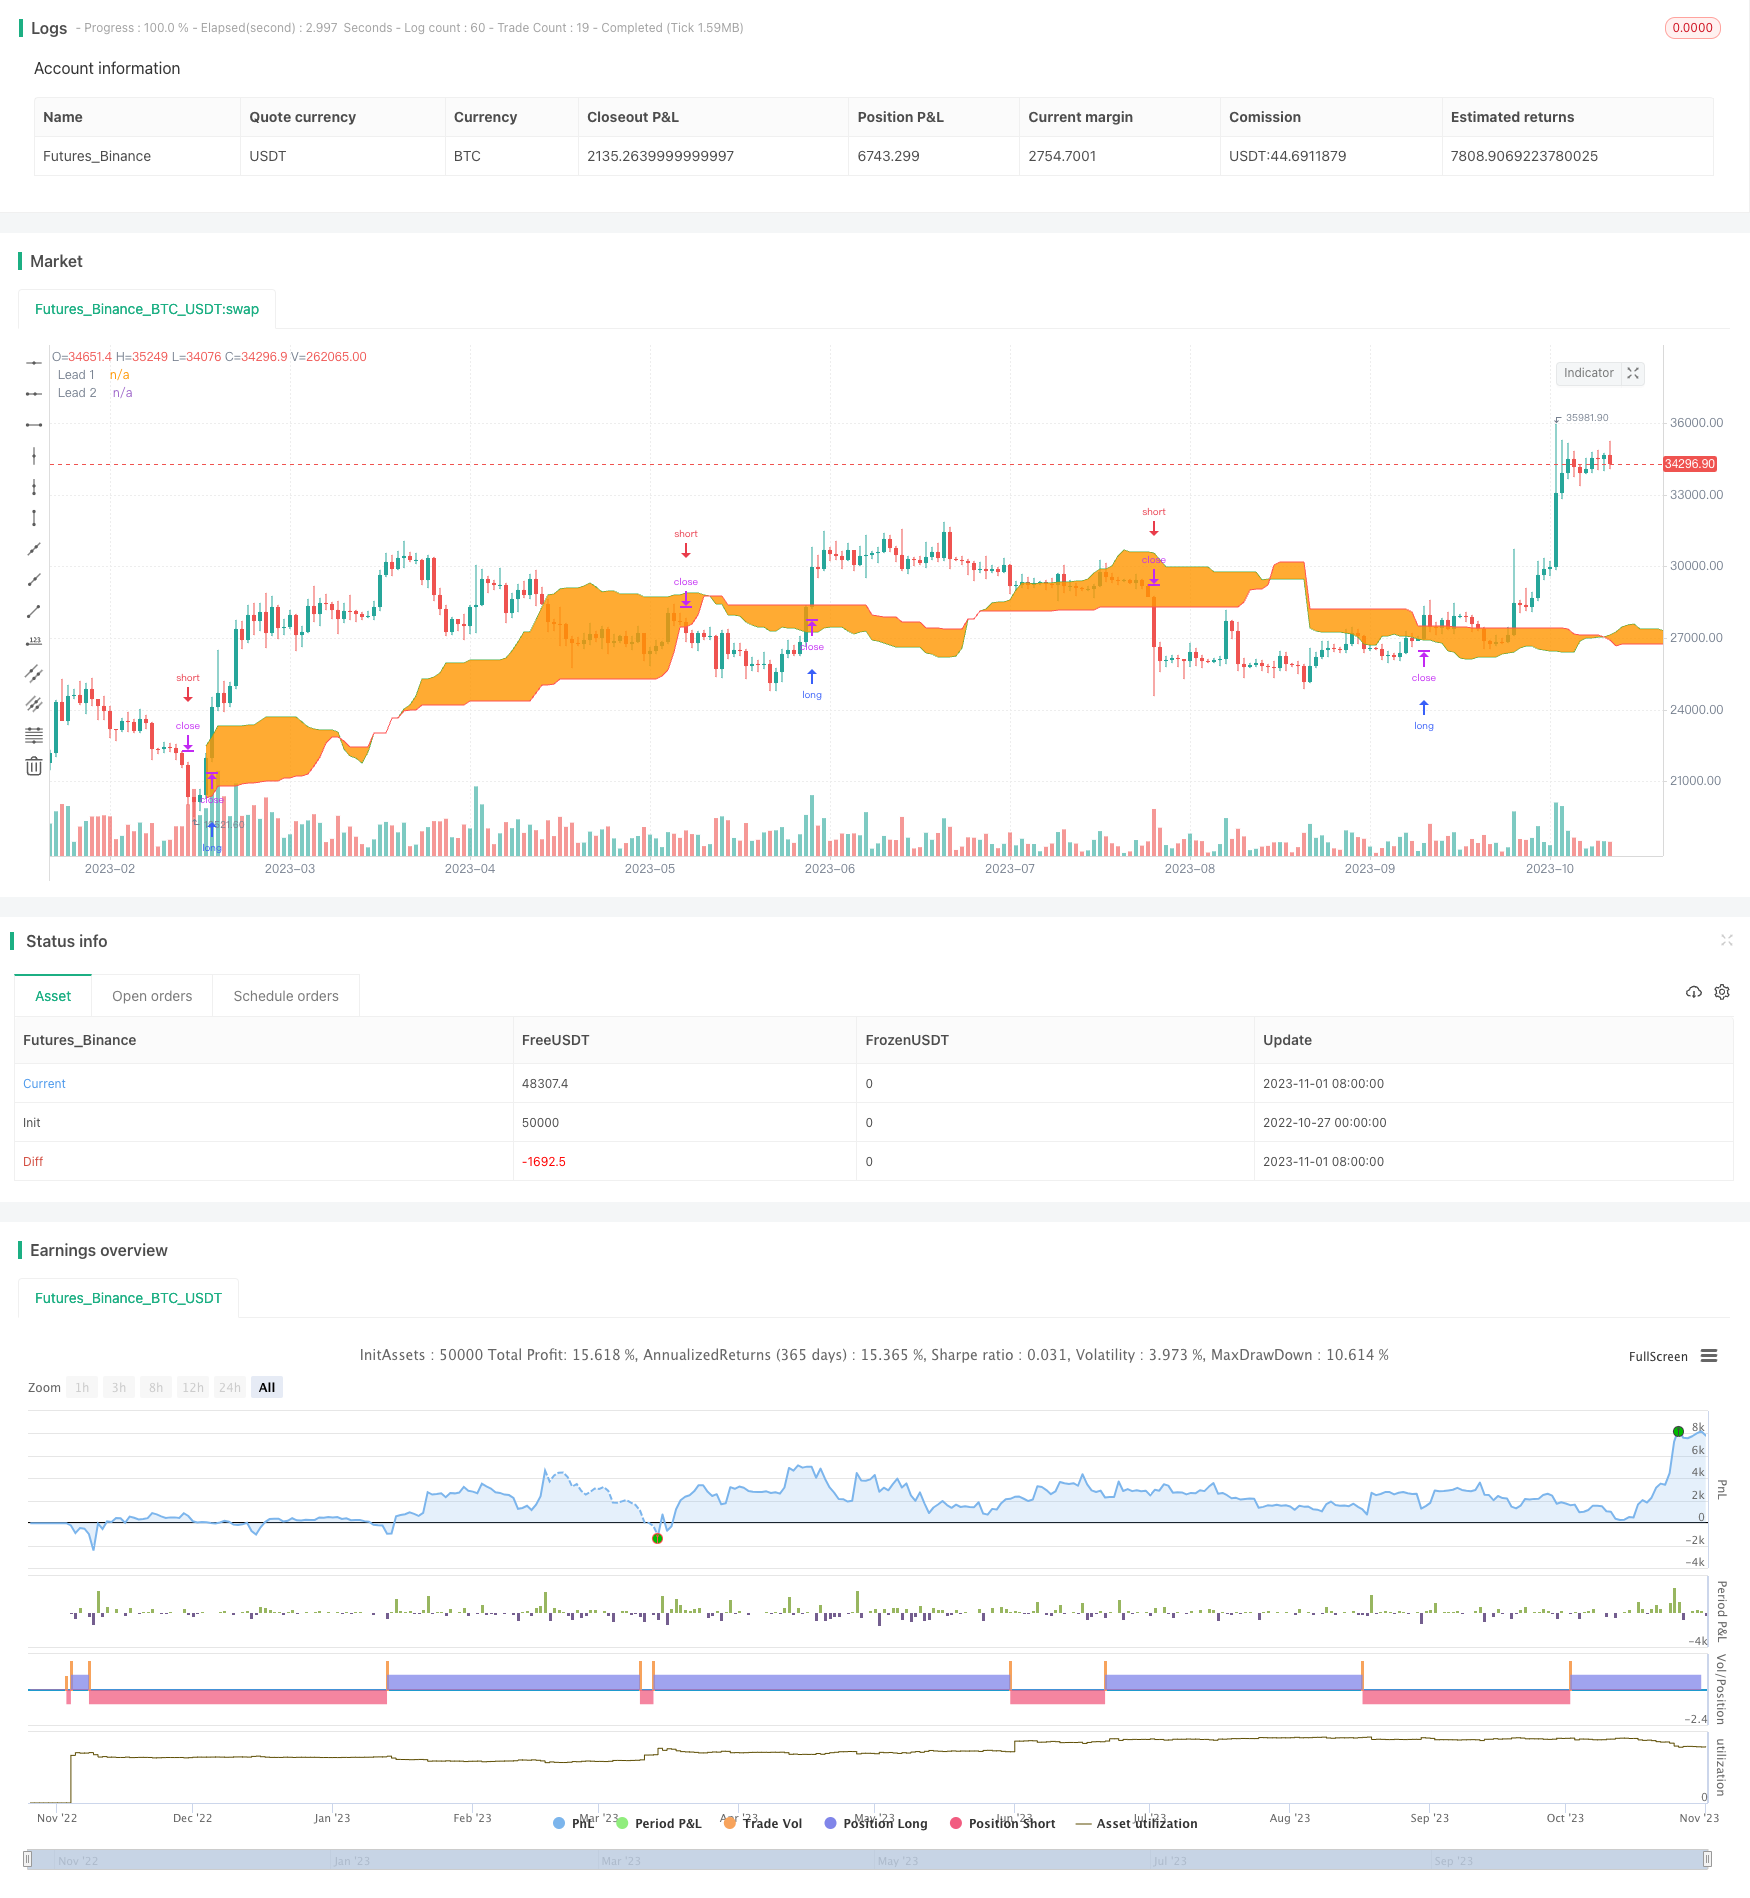
转换线和基准线的均值构成领先线1,延迟线构成领先线2,两条领先线之间形成云带,云带上沿和下沿可判断趋势方向。
当价格上穿云带时,开仓做多;当价格下穿云带时,开仓做空。
以云带上沿和下沿为止损位,设置止损单,跟踪价格趋势。
具体来说,策略中定义了一目均衡表的三条曲线,通过计算它们的均值得到领先线1和领先线2。然后根据价格突破云带的上下边界判断趋势方向。在开仓做多做空后,以云带上下边界价格为止损位设置止损单,实现趋势跟踪止损。
优势分析
该策略具有以下优势:
使用一目均衡表判断趋势方向准确可靠。一目均衡表综合多个周期价格的信息,能有效过滤市场噪音,判断趋势。
止损位设置合理。以云带上下边界为止损位,既能确保止损范围合理,也能充分跟踪趋势。
策略稳定可靠。一目均衡表本身具有滤波噪音的能力,结合止损单可有效控制风险。
可按需要灵活调整参数。转换线、基准线和延迟线周期可根据市场调整,实现对不同周期的适应。
策略思路清晰易于理解。基于趋势跟踪思路设计,容易掌握使用。
风险分析
该策略也存在以下风险:
突破止损风险。当价格出现剧烈波动时,可能触发止损单,退出原有盈利头寸。
震荡行情不适用。当价格处于长时间震荡行情时,止损单容易被频繁触发,造成交易过于密集。
参数设置风险。转换线、基准线和延迟线周期设置不当,可能导致止损范围过大或过小。
期货交易滑点成本风险。频繁开平仓导致的滑点成本可能影响交易盈利。
程序化交易风险。停机、网络中断、程序bug等可能影响交易执行。
针对上述风险,可以采取以下应对措施:优化参数设置,调整止损算法,提高服务器稳定性,做好风控,严格测试程序。
优化方向
该策略可以从以下方面进行优化:
优化参数设置。可以测试不同周期参数的组合,找到最佳参数。
优化止损算法。可以研究移动止损、振荡止损等算法,降低止损被触发概率。
结合多个指标判断。可以加入更多指标,如MACD、KDJ等,提高决策准确性。
增加自动关闭亏损单功能。避免亏损扩大。
加入重新入场机制。在止损退出后,可以考虑重新入场。
优化资金管理。可以研究动态仓位调整,让盈利能更好发挥作用。
总结
总体来说,该策略思路清晰,利用一目均衡表判断趋势方向,并以云带上下边界进行趋势跟踪止损,可以有效控制风险,具有较强的实用性。但也存在一定的风险,需要优化参数设置、止损算法等,并做好风控,才能在实盘中稳定获得收益。该策略为我们提供了一个基于趋势跟踪思路设计止损策略的良好范例。
/*backtest
start: 2022-10-27 00:00:00
end: 2023-11-02 00:00:00
period: 1d
basePeriod: 1h
exchanges: [{"eid":"Futures_Binance","currency":"BTC_USDT"}]
*/

//@version=4
strategy(title = "Noro's Ichimoku Stop Strategy", shorttitle = "Ichimoku Stop Strategy", overlay = true, default_qty_type = strategy.percent_of_equity, default_qty_value = 100, pyramiding = 0)

//Settings
needlong = input(true, defval = true, title = "Long")
needshort = input(true, defval = true, title = "Short")
conversionPeriods = input(9, minval = 1, title = "Conversion Periods")
basePeriods = input(26, minval = 1, title = "Base Periods")
laggingSpan2Periods = input(52, minval = 1, title = "Lagging Span")
fromyear = input(1900, defval = 1900, minval = 1900, maxval = 2100, title = "From Year")
toyear = input(2100, defval = 2100, minval = 1900, maxval = 2100, title = "To Year")
frommonth = input(01, defval = 01, minval = 01, maxval = 12, title = "From Month")
tomonth = input(12, defval = 12, minval = 01, maxval = 12, title = "To Month")
fromday = input(01, defval = 01, minval = 01, maxval = 31, title = "From day")
today = input(31, defval = 31, minval = 01, maxval = 31, title = "To day")

//Ichimoku
donchian(len) => avg(lowest(len), highest(len))
conversionLine = donchian(conversionPeriods)
baseLine = donchian(basePeriods)
leadLine1 = avg(conversionLine, baseLine)
leadLine2 = donchian(laggingSpan2Periods)

//Cloud
p1 = plot(leadLine1, offset = basePeriods, color=color.green, title="Lead 1", transp = 100)
p2 = plot(leadLine2, offset = basePeriods, color=color.red, title="Lead 2", transp = 100)
fill(p1, p2)

//Signals
max = max(leadLine1[basePeriods], leadLine2[basePeriods])
min = min(leadLine1[basePeriods], leadLine2[basePeriods])
up = low > max
dn = high < min

if max > 0
    strategy.entry("Long", strategy.long, needlong ? na : 0, stop = max)
    strategy.entry("Short", strategy.short, needshort ? na : 0, stop = min)