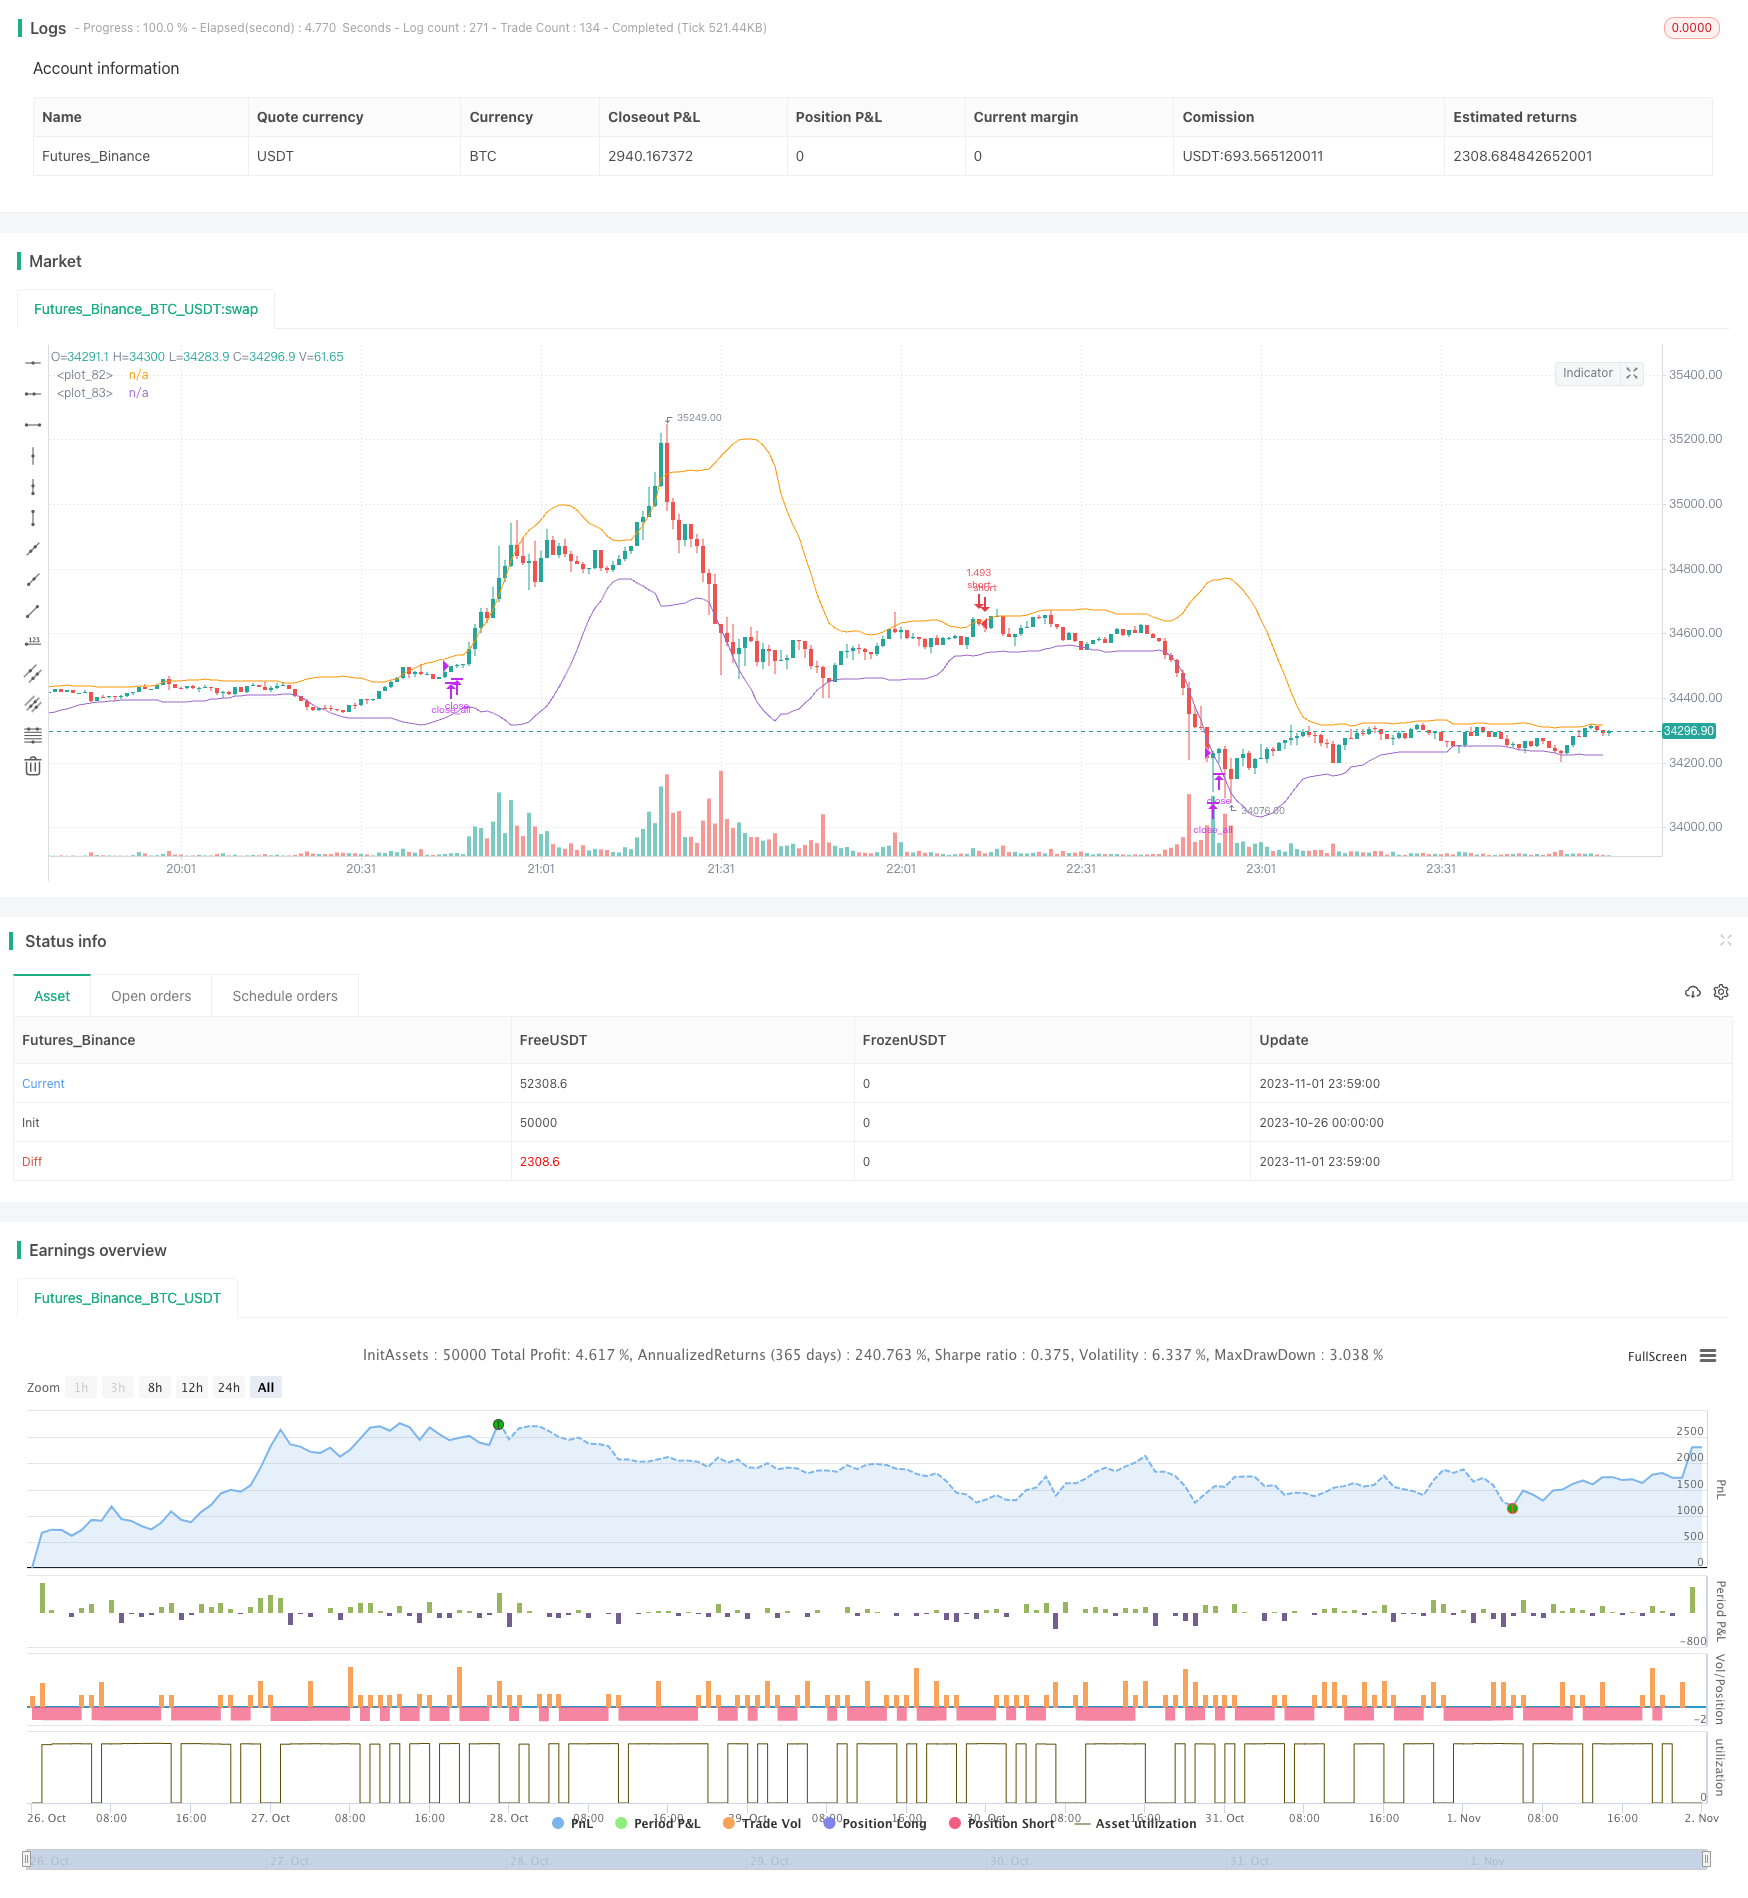
概述
该策略使用布林带指标来寻找多空突破点,并结合ADX指标来过滤低波动的不利行情,实现趋势跟踪。
策略原理
该策略主要基于布林带指标来判断多空方向。布林带中线为N日收盘价的移动平均线,带宽通过标准差计算得到。当价格突破下轨时,判断为多头信号;当价格突破上轨时,判断为空头信号。
为了避免非趋势行情的无效突破带来的错误交易,该策略融合ADX指标来过滤低波动行情。只有当ADX值低于设定阈值时,才会发出买卖信号。当ADX值高于阈值时,则平掉所有头寸,等待行情转趋势。
该策略还设定了回调止损和向上追踪止盈。具体来说,每次开仓后,会记录此前N日的最低价作为该方向的回调止损位,最高价作为向上追踪止盈位。这可以锁定盈利,同时尽量减少反转带来的损失。
从代码逻辑来看,该策略首先计算布林带及ADX指标参数。然后判断价格是否突破布林带上下轨,同时ADX值是否低于阈值,如果满足则产生买卖信号。之后根据是否持仓以及持仓方向,实时更新和跟踪止损止盈位。
优势分析
- 利用布林带判断明确的多空突破点,可以抓住趋势机会
- 综合ADX指标过滤,避免在无明确趋势时随波逐流
- 回调止损可以有效控制单笔损失
- 向上追踪止盈可以锁定大部分利润
风险分析
- 布林带突破没有考虑量能关系,可能产生假突破
- ADX过滤判断不当也可能错过趋势机会
- 止损止盈过于接近可能被反转止出
- 参数设定不当也会影响策略表现
可以考虑结合其他指标判断량能支持,确保突破 VALID ;优化ADX过滤条件,利用ADX曲线斜率来判断趋势转折点;适当放宽止损止盈范围,防止过于接近被止出。
优化方向
- 优化布林带长度参数,寻找最佳突破效果
- 优化ADX过滤条件,平衡趋势判断和误判率
- 添加其他指标判断量能支持度,避免假突破
- 优化回调止损幅度,防止过于敏感被止损
- 优化追踪止盈幅度,适当拉大间距
总结
该策略整体思路清晰简洁,利用布林带判断明确的多空突破信号,并用ADX指标来过滤无明确趋势的 Choppy 行情,从而锁定趋势机会。同时设置回调止损和追踪止盈来控制风险和锁定利润。该策略易于理解实施,值得进一步测试和优化,可以成为基础趋势跟踪策略。
策略源码
/*backtest
start: 2023-10-26 00:00:00
end: 2023-11-02 00:00:00
period: 1m
basePeriod: 1m
exchanges: [{"eid":"Futures_Binance","currency":"BTC_USDT"}]
*/

// This source code is subject to the terms of the Mozilla Public License 2.0 at https://mozilla.org/MPL/2.0/
// © tweakerID

// This strategy uses Bollinger Bands to buy when the price
// crosses over the lower band and sell when it crosses down
// the upper band. It only takes trades when the ADX is
// below a certain level, and exits all trades when it's above it.

//@version=4
strategy("BB + ADX Strategy", overlay=true, default_qty_type=strategy.percent_of_equity, default_qty_value=100, commission_value = 0.04, initial_capital=100)

//Inputs
i_reverse=input(false, title="Reverse Trades")
i_ADXClose=input(true, title="ADX Close")
i_SL=input(false, title="Use Swing Lo/Hi Stop Loss & Take Profit")
i_SwingLookback=input(20, title="Swing Lo/Hi Lookback")
i_SLExpander=input(defval=0, step=.5, title="SL Expander")
i_TPExpander=input(defval=0, step=.5, title="TP Expander")

//ADX Calculations
adxlen = input(14, title="ADX Smoothing")
dilen = input(20, title="DI Length")
dirmov(len) =>
	up = change(high)
	down = -change(low)
	plusDM = na(up) ? na : (up > down and up > 0 ? up : 0)
	minusDM = na(down) ? na : (down > up and down > 0 ? down : 0)
	truerange = rma(tr, len)
	plus = fixnan(100 * rma(plusDM, len) / truerange)
	minus = fixnan(100 * rma(minusDM, len) / truerange)
	[plus, minus]
adx(dilen, adxlen) =>
	[plus, minus] = dirmov(dilen)
	sum = plus + minus
	adx = 100 * rma(abs(plus - minus) / (sum == 0 ? 1 : sum), adxlen)
sig = adx(dilen, adxlen)
adxlevel=input(30, step=5)

//BB Calculations
BBCALC=input(false, title="-----------BB Inputs-----------")

length = input(20, minval=1)
mult = input(2.0, minval=0.001, maxval=50)
MAlen=input(defval=9)
source = close
basis = sma(source, length)
dev = mult * stdev(source, length)
upper = basis + dev
lower = basis - dev

//Entry Logic
BUY = crossover(source, lower) and sig < adxlevel
SELL = crossunder(source, upper) and sig < adxlevel

//SL & TP Calculations
SwingLow=lowest(i_SwingLookback)
SwingHigh=highest(i_SwingLookback)
bought=strategy.position_size != strategy.position_size[1]
LSL=valuewhen(bought, SwingLow, 0)-((valuewhen(bought, atr(14), 0))*i_SLExpander)
SSL=valuewhen(bought, SwingHigh, 0)+((valuewhen(bought, atr(14), 0))*i_SLExpander)
lTP=strategy.position_avg_price + (strategy.position_avg_price-(valuewhen(bought, SwingLow, 0))+((valuewhen(bought, atr(14), 0))*i_TPExpander))
sTP=strategy.position_avg_price - (valuewhen(bought, SwingHigh, 0)-strategy.position_avg_price)-((valuewhen(bought, atr(14), 0))*i_TPExpander)
islong=strategy.position_size > 0
isshort=strategy.position_size < 0
SL= islong ? LSL : isshort ? SSL : na
TP= islong ? lTP : isshort ? sTP : na

//Entries
strategy.entry("long", long=i_reverse?false:true, when=BUY)
strategy.entry("short", long=i_reverse?true:false, when=SELL)

//EXITS
if i_ADXClose
    strategy.close_all(when=sig > adxlevel)
if i_SL
    strategy.exit("longexit", "long", stop=SL, limit=TP)
    strategy.exit("shortexit", "short", stop=SL, limit=TP)

//Plots
plot(i_SL ? SL : na, color=color.red, style=plot.style_cross, title="SL")
plot(i_SL ? TP : na, color=color.green, style=plot.style_cross, title="TP")
plot(upper)
plot(lower)