Trend Tracking Strategy Based on Momentum Breakout

Author: ChaoZhang, Date: 2023-11-06 09:37:44
Tags:

img

Overview

This strategy combines multiple technical indicators to identify trend direction and track the momentum when breakout happens, aiming for excess return.

Strategy Logic

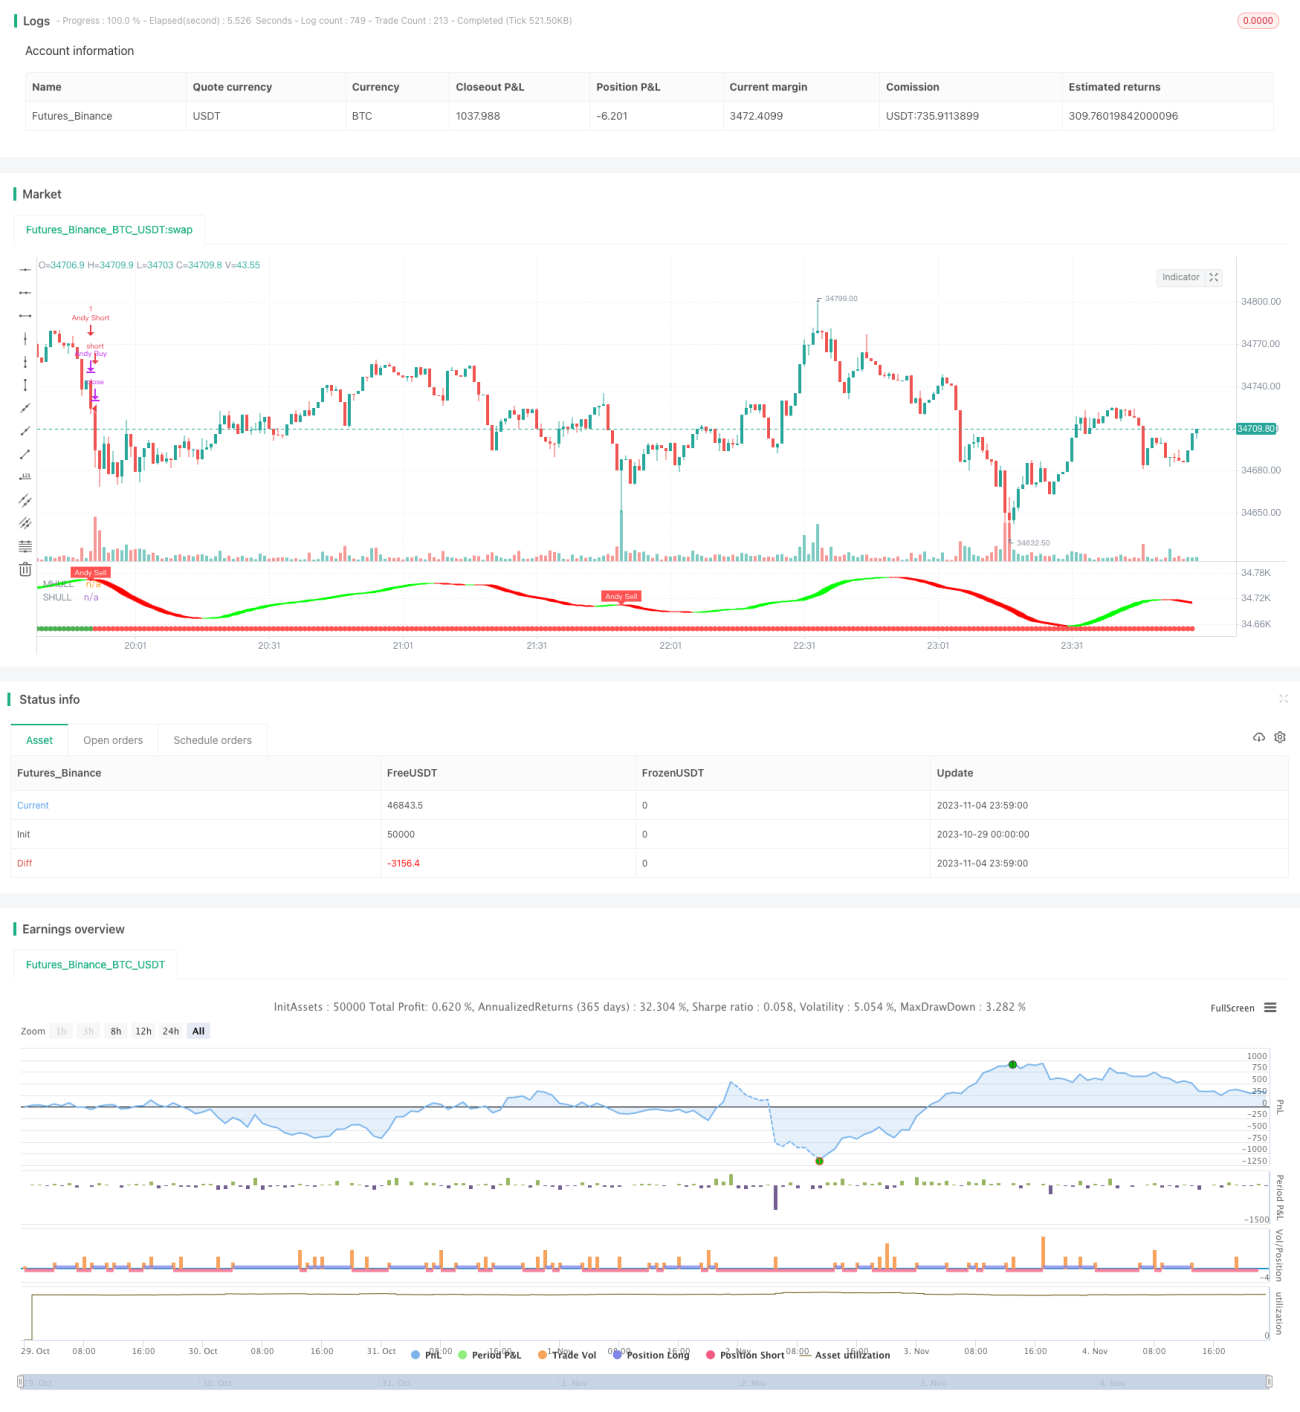
  1. Use Donchian Channel to determine the overall trend. A breakout of the channel confirms trend reversal.

  2. Hull Moving Average assists in judging trend direction. It is sensitive to price change and can early detect trend reversal.

  3. Halftrend system generates buy and sell signals based on price channel and ATR range. It avoids false breakout.

  4. When Donchian, Hull and Halftrend signals align, a strong momentum breakout is confirmed and strategy enters.

  5. Exit when above indicators give reverse signal, indicating trend reversal.

Advantage Analysis

  • More robust signal with multiple indicators. Donchian for fundamentals, Hull and Halftrend for details. Catch trend turning points accurately.

  • Pursuit of excess return by momentum breakout. Only enter on strong breakout, avoiding whipsaw in consolidation.

  • Strict stop loss to ensure capital safety. Loss is capped once reverse signal shows.

  • Flexible parameter tuning for different markets. Channel length, ATR range etc can be adjusted and optimized.

  • Easy to understand and implement. Indicator combo is simple and clear, easy to code.

Risk Analysis

  • Miss early trend opportunity. Entry is relatively late, early rally is not captured.

  • Loss from failed breakout and reversal. Drawdown may occur after entry.

  • False signal from bad parameter. Indicators may fail due to bad tuning.

  • Limited trade frequency. Only clear breakouts are traded, resulting in low annual trade numbers.

Optimization Directions

  • Optimize parameter combinations by testing. Find best parameters.

  • Add trailing stop loss condition. Avoid premature stop loss.

  • Introduce more filters like MACD, KDJ. To filter bad signals.

  • Optimize parameters for different sessions. Different sessions can be tuned separately.

  • Improve capital efficiency via leverage, DCA etc. Better capital utilization.

Summary

This strategy combines multiple indicators to identify momentum breakout of established trend, and profit from trend tracking. Strict stop loss manages risk. Flexible parameters adapt to different market environments. Although trade frequency is low, each trade targets high profitability. The strategy can be improved continuously through parameter tuning, additional filters etc.


/*backtest
start: 2023-10-29 00:00:00
end: 2023-11-05 00:00:00
period: 1m
basePeriod: 1m
exchanges: [{"eid":"Futures_Binance","currency":"BTC_USDT"}]
*/

// This source code is subject to the terms of the Mozilla Public License 2.0 at https://mozilla.org/MPL/2.0/
// © kgynofomo

// @version=5
strategy(title="[Salavi] | Andy Super Pro Strategy",overlay = true)

//Doinchian Trend Ribbon
dlen = input.int(defval=30, minval=10)

dchannel(len) =>
    float hh = ta.highest(len)
    float ll = ta.lowest(len)

    int trend = 0
    trend := close > hh[1] ? 1 : close < ll[1] ? -1 : nz(trend[1])
    trend

dchannelalt(len, maintrend) =>
    float hh = ta.highest(len)
    float ll = ta.lowest(len)

    int trend = 0
    trend := close > hh[1] ? 1 : close < ll[1] ? -1 : nz(trend[1])
    maintrend == 1 ? trend == 1 ? #00FF00ff : #00FF009f : maintrend == -1 ? trend == -1 ? #FF0000ff : #FF00009f : na

maintrend = dchannel(dlen)
donchian_bull = maintrend==1
donchian_bear = maintrend==-1


//Hulls
src = input(hlc3, title='Source')
modeSwitch = input.string('Hma', title='Hull Variation', options=['Hma', 'Thma', 'Ehma'])
length = input(55, title='Length')
lengthMult = input(1.0, title='Length multiplier ')

useHtf = false
htf = '240'

switchColor = true
candleCol = false
visualSwitch = true
thicknesSwitch = 1
transpSwitch = 40

//FUNCTIONS
//HMA
HMA(_src, _length) =>
    ta.wma(2 * ta.wma(_src, _length / 2) - ta.wma(_src, _length), math.round(math.sqrt(_length)))
//EHMA    
EHMA(_src, _length) =>
    ta.ema(2 * ta.ema(_src, _length / 2) - ta.ema(_src, _length), math.round(math.sqrt(_length)))
//THMA    
THMA(_src, _length) =>
    ta.wma(ta.wma(_src, _length / 3) * 3 - ta.wma(_src, _length / 2) - ta.wma(_src, _length), _length)

//SWITCH
Mode(modeSwitch, src, len) =>
    modeSwitch == 'Hma' ? HMA(src, len) : modeSwitch == 'Ehma' ? EHMA(src, len) : modeSwitch == 'Thma' ? THMA(src, len / 2) : na

//OUT
_hull = Mode(modeSwitch, src, int(length * lengthMult))
HULL = useHtf ? request.security(syminfo.ticker, htf, _hull) : _hull
MHULL = HULL[0]
SHULL = HULL[2]

//COLOR
hullColor = switchColor ? HULL > HULL[2] ? #00ff00 : #ff0000 : #ff9800
hull_bull = HULL > HULL[2]
bull_start = hull_bull and hull_bull[1]==false
hull_bear = HULL < HULL[2]
bear_start = hull_bear and hull_bear[1]==false

barcolor(color=candleCol ? switchColor ? hullColor : na : na)

//halftrend
amplitude = input(title='Amplitude', defval=2)
channelDeviation = input(title='Channel Deviation', defval=2)
// showArrows = input(title='Show Arrows', defval=true)
// showChannels = input(title='Show Channels', defval=true)

var int trend = 0
var int nextTrend = 0
var float maxLowPrice = nz(low[1], low)
var float minHighPrice = nz(high[1], high)

var float up = 0.0
var float down = 0.0
float atrHigh = 0.0
float atrLow = 0.0
float arrowUp = na
float arrowDown = na

atr2 = ta.atr(100) / 2
dev = channelDeviation * atr2

highPrice = high[math.abs(ta.highestbars(amplitude))]
lowPrice = low[math.abs(ta.lowestbars(amplitude))]
highma = ta.sma(high, amplitude)
lowma = ta.sma(low, amplitude)

if nextTrend == 1
    maxLowPrice := math.max(lowPrice, maxLowPrice)

    if highma < maxLowPrice and close < nz(low[1], low)
        trend := 1
        nextTrend := 0
        minHighPrice := highPrice
        minHighPrice
else
    minHighPrice := math.min(highPrice, minHighPrice)

    if lowma > minHighPrice and close > nz(high[1], high)
        trend := 0
        nextTrend := 1
        maxLowPrice := lowPrice
        maxLowPrice

if trend == 0
    if not na(trend[1]) and trend[1] != 0
        up := na(down[1]) ? down : down[1]
        arrowUp := up - atr2
        arrowUp
    else
        up := na(up[1]) ? maxLowPrice : math.max(maxLowPrice, up[1])
        up
    atrHigh := up + dev
    atrLow := up - dev
    atrLow
else
    if not na(trend[1]) and trend[1] != 1
        down := na(up[1]) ? up : up[1]
        arrowDown := down + atr2
        arrowDown
    else
        down := na(down[1]) ? minHighPrice : math.min(minHighPrice, down[1])
        down
    atrHigh := down + dev
    atrLow := down - dev
    atrLow

ht = trend == 0 ? up : down

var color buyColor = color.blue
var color sellColor = color.red

htColor = trend == 0 ? buyColor : sellColor
// htPlot = plot(ht, title='HalfTrend', linewidth=2, color=htColor)

// atrHighPlot = plot(showChannels ? atrHigh : na, title='ATR High', style=plot.style_circles, color=color.new(sellColor, 0))
// atrLowPlot = plot(showChannels ? atrLow : na, title='ATR Low', style=plot.style_circles, color=color.new(buyColor, 0))

// fill(htPlot, atrHighPlot, title='ATR High Ribbon', color=color.new(sellColor, 90))
// fill(htPlot, atrLowPlot, title='ATR Low Ribbon', color=color.new(buyColor, 90))

HalfTrend_buySignal = not na(arrowUp) and trend == 0 and trend[1] == 1
HalfTrend_sellSignal = not na(arrowDown) and trend == 1 and trend[1] == 0

// plotshape(showArrows and buySignal ? atrLow : na, title='Arrow Up', style=shape.triangleup, location=location.absolute, size=size.tiny, color=color.new(buyColor, 0))
// plotshape(showArrows and sellSignal ? atrHigh : na, title='Arrow Down', style=shape.triangledown, location=location.absolute, size=size.tiny, color=color.new(sellColor, 0))


//ema
filter_ema = ta.ema(close,200)
ema_bull = close>filter_ema
ema_bear = close<filter_ema

atr_length = input.int(7)
atr = ta.atr(atr_length)
atr_rsi_length = input.int(50)
atr_rsi = ta.rsi(atr,atr_rsi_length)
atr_valid = atr_rsi>50

longCondition = bull_start and atr_valid
shortCondition = bear_start and atr_valid

Exit_long_condition = shortCondition
Exit_short_condition = longCondition

if longCondition
    strategy.entry("Andy Buy",strategy.long, limit=close,comment="Andy Buy Here")

if Exit_long_condition
    strategy.close("Andy Buy",comment="Andy Buy Out")
    // strategy.entry("Andy fandan Short",strategy.short, limit=close,comment="Andy 翻單 short Here")
    // strategy.close("Andy fandan Buy",comment="Andy short Out")


if shortCondition
    strategy.entry("Andy Short",strategy.short, limit=close,comment="Andy short Here")


// strategy.exit("STR","Long",stop=longstoploss)
if Exit_short_condition
    strategy.close("Andy Short",comment="Andy short Out")
    // strategy.entry("Andy fandan Buy",strategy.long, limit=close,comment="Andy 翻單 Buy Here")
    // strategy.close("Andy fandan Short",comment="Andy Buy Out")


inLongTrade = strategy.position_size > 0
inLongTradecolor = #58D68D
notInTrade = strategy.position_size == 0
inShortTrade = strategy.position_size < 0

// bgcolor(color = inLongTrade?color.rgb(76, 175, 79, 70):inShortTrade?color.rgb(255, 82, 82, 70):na)
plotshape(close!=0,location = location.bottom,color = inLongTrade?color.green:inShortTrade?color.red:na)


plotshape(longCondition, title='Buy', text='Andy Buy', style=shape.labelup, location=location.belowbar, color=color.new(color.green, 0), textcolor=color.new(color.white, 0), size=size.tiny)
plotshape(shortCondition, title='Sell', text='Andy Sell', style=shape.labeldown, location=location.abovebar, color=color.new(color.red, 0), textcolor=color.new(color.white, 0), size=size.tiny)

Fi1 = plot(MHULL, title='MHULL', color=hullColor, linewidth=thicknesSwitch, transp=50)
Fi2 = plot(SHULL, title='SHULL', color=hullColor, linewidth=thicknesSwitch, transp=50)

fill(Fi1, Fi2, title='Band Filler', color=hullColor, transp=transpSwitch)


More