概述
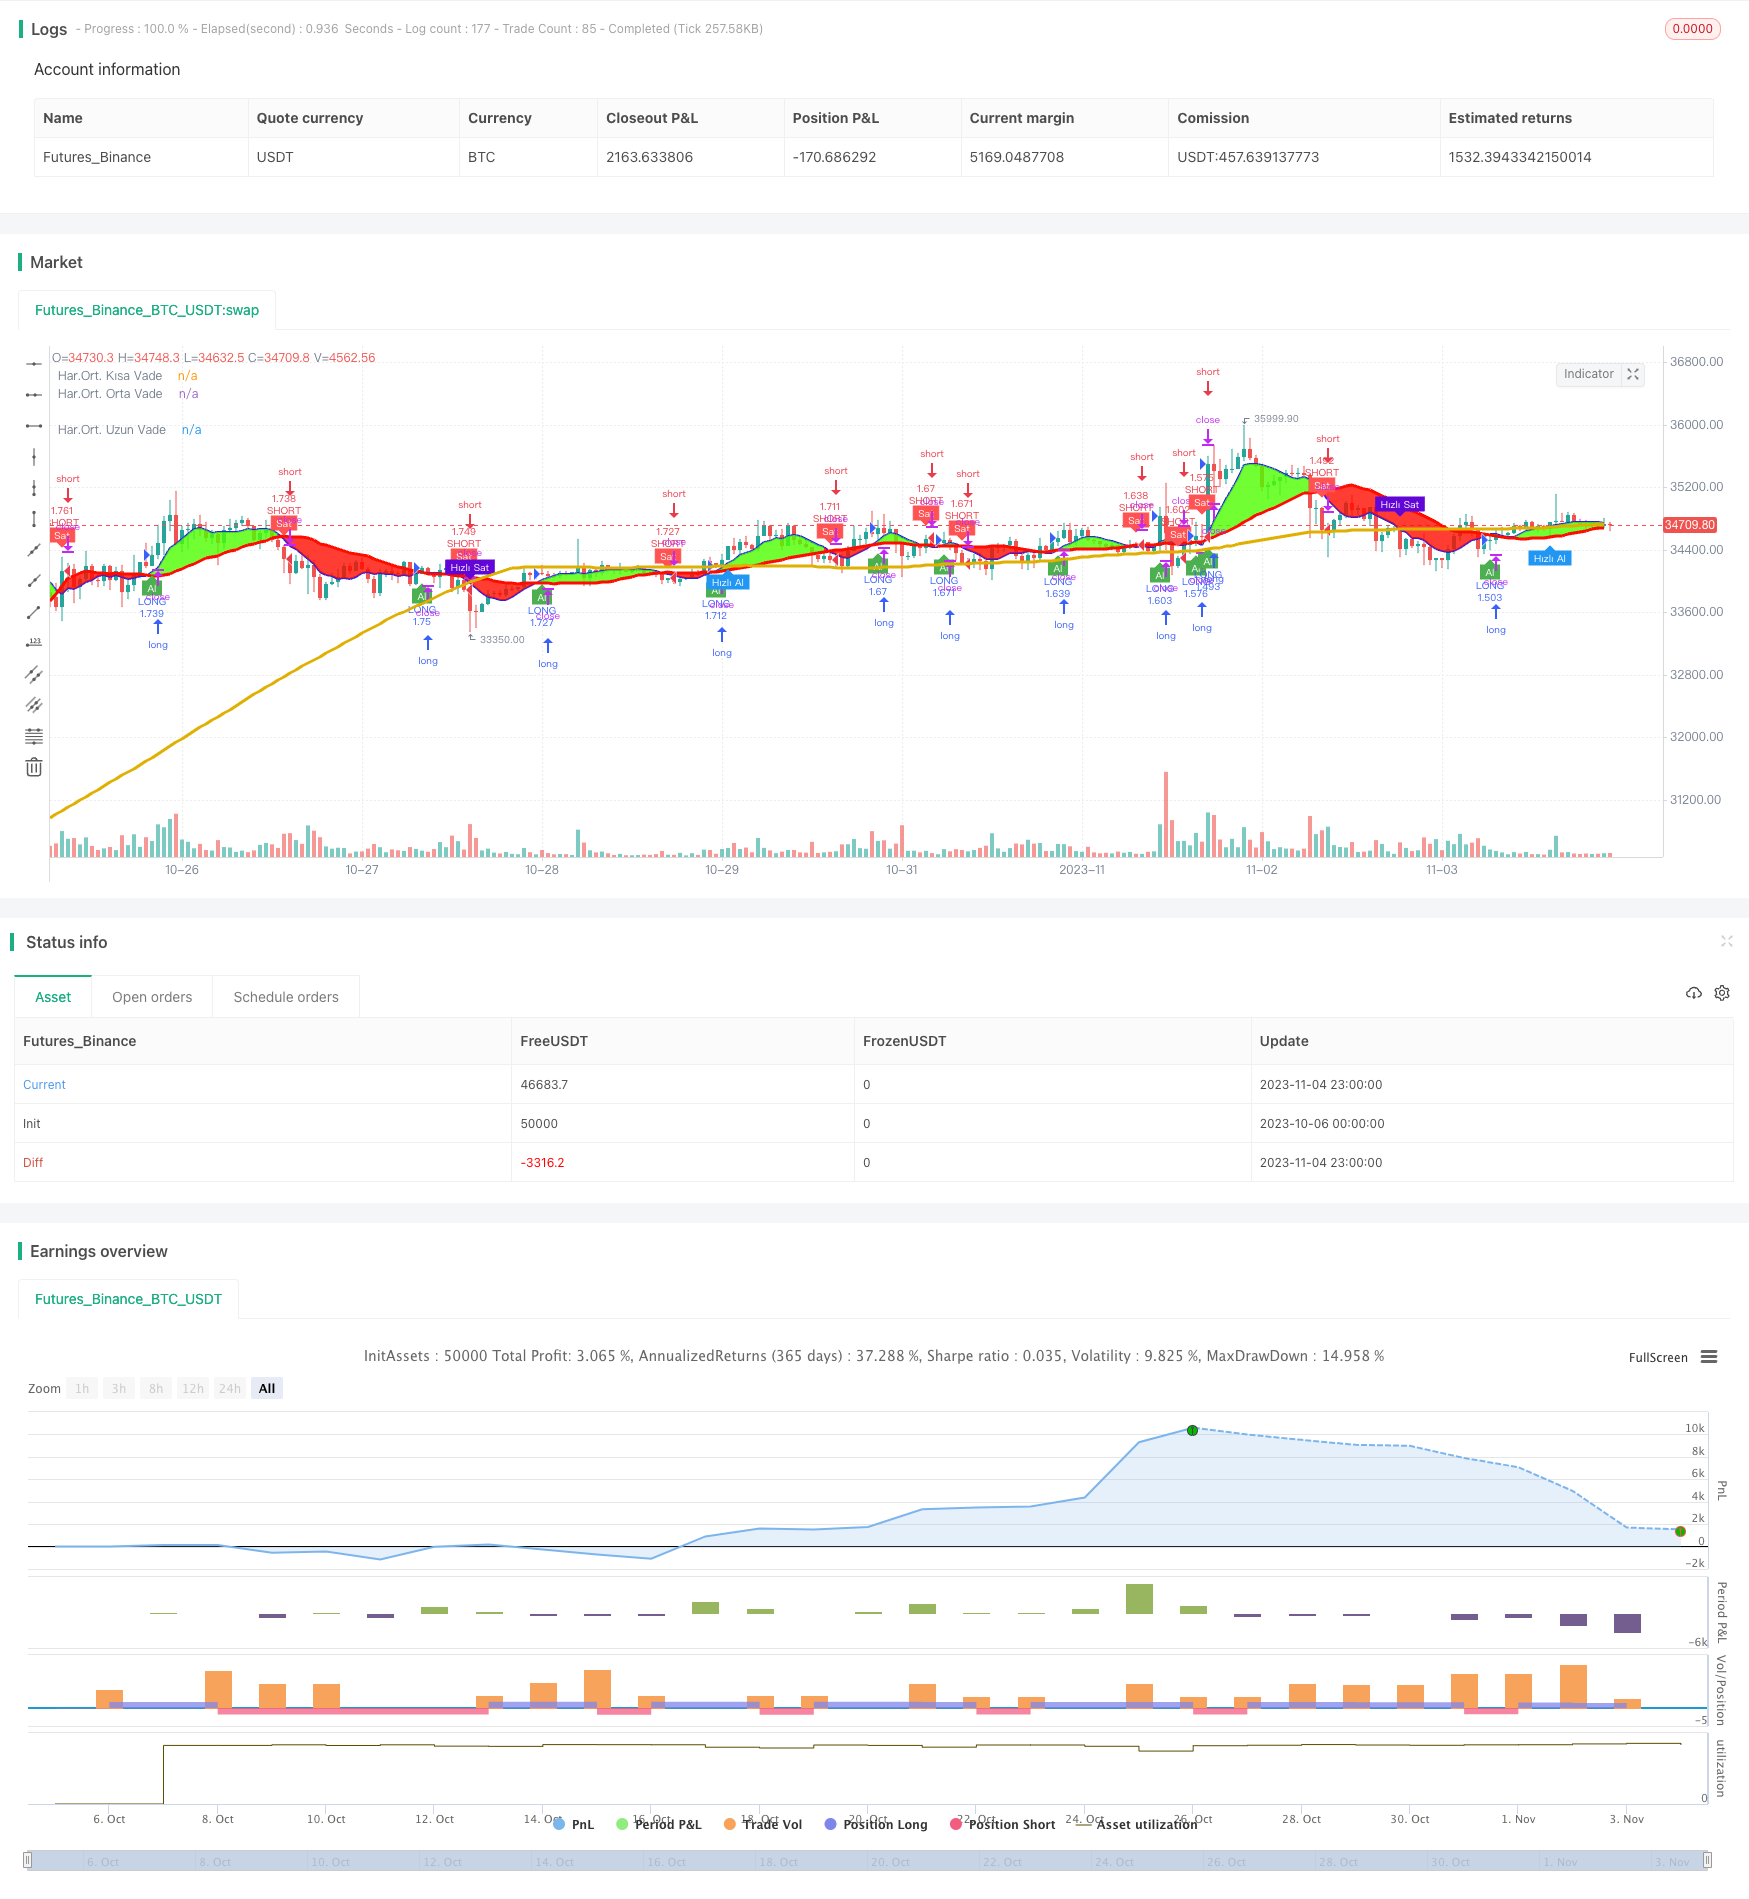
三均线交叉策略利用不同时间周期的移动平均线的交叉作为买入和卖出信号,属于趋势跟踪策略。该策略使用三条移动平均线,包括短期移动平均线、中期移动平均线和长期移动平均线,根据它们的交叉形成交易信号。
策略原理
该策略首先计算短期移动平均线(默认7日)、中期移动平均线(默认25日)和长期移动平均线(默认99日),然后根据以下规则产生交易信号:
当短期移动平均线上穿中期移动平均线时,产生买入信号。
当短期移动平均线下穿中期移动平均线时,产生卖出信号。
当短期移动平均线上穿长期移动平均线时,产生快速买入信号。
当短期移动平均线下穿长期移动平均线时,产生快速卖出信号。
该策略认为,短期移动平均线上穿中期移动平均线表示市场趋势转为上涨,因此产生买入信号;而短期移动平均线下穿中期移动平均线则表示市场趋势转为下跌,因此产生卖出信号。同理,短期移动平均线与长期移动平均线的交叉也会产生快速的交易信号,以捕捉较长线的趋势变化。
优势分析
- 策略逻辑简单清晰,容易理解和实现。
- 利用多时间周期分析,可以有效捕捉市场趋势的变化。
- 可以通过调整移动平均线的周期,优化策略的参数。
- 可视化的交叉信号,直观地反映趋势的变化。
风险分析
- 移动平均线存在滞后性,可能错过趋势的反转点。
- 多头市场中,短线上穿长线的假信号可能过多。
- 空头市场中,短线下穿长线的假信号可能过多。
- 快速买入和卖出信号可能过于灵敏,增加交易次数和手续费。
可通过适当调整移动平均线周期,或增加过滤条件来优化,减少假信号。也可以适当缩短快速交易周期,降低交易频率。
优化方向
- 增加过滤条件,例如大于某个交易量或者价格变化百分比时才产生信号。
- 结合其他指标过滤,例如MACD,KDJ等,避免在无明确趋势时出错交易。
- 优化移动平均线周期的组合,降低假信号。
- 区分多头和空头市场,优化买入和卖出的参数。
- 考虑交易成本,调整快速交易的参数,控制交易频率。
总结
三均线交叉策略整体比较简单直接,通过不同时间周期均线的交叉判定趋势方向,以产生交易信号。该策略易于实现,参数调整灵活,可以捕捉趋势的变化。但也存在移动平均线滞后的问题,以及假信号过多的风险。可以通过添加过滤条件,优化参数组合等方法来改进策略的效果。该策略适合对趋势交叉感兴趣的交易者进行优化应用。
策略源码
/*backtest
start: 2023-10-06 00:00:00
end: 2023-11-05 00:00:00
period: 1h
basePeriod: 15m
exchanges: [{"eid":"Futures_Binance","currency":"BTC_USDT"}]
*/

// This source code is subject to the terms of the Mozilla Public License 2.0 at https://mozilla.org/MPL/2.0/
// © dadashkadir

//@version=4
strategy("Üç Hareketli Ortalama Str.", overlay=true, initial_capital=10000, commission_value=0.047, default_qty_type=strategy.percent_of_equity, default_qty_value=100, pyramiding=0, calc_on_order_fills=true)

kisa = input(title = "Kısa Vade - Gün", defval = 7,  minval = 1)
orta = input(title = "Orta Vade - Gün", defval = 25, minval = 1)
uzun = input(title = "Uzun Vade - Gün", defval = 99, minval = 1)

sma7  = sma(close, kisa)
sma25 = sma(close, orta)
sma99  = sma(close, uzun)

alTrend  = plot (sma7, color=#2323F1, linewidth=2, title="Har.Ort. Kısa Vade", transp=0)
satTrend = plot (sma25, color=#FF0C00, linewidth=3, title="Har.Ort. Orta Vade", transp=0)
ort99    = plot (sma99, color=#DFB001, linewidth=3, title="Har.Ort. Uzun Vade", transp=0)

zamanaralik = input (2020, title="Backtest Başlangıç Tarihi")

al  = crossover (sma7, sma25) and zamanaralik <= year
sat = crossover (sma25, sma7) and zamanaralik <= year

hizlial = crossover (sma7, sma99) and zamanaralik <= year
hizlisat = crossover (sma99, sma7) and zamanaralik <= year

alkosul  = sma7 >= sma25
satkosul = sma25 >= sma7

hizlialkosul  = sma7 >= sma99
hizlisatkosul = sma99 >= sma7

plotshape(al,  title = "Buy",  text = 'Al',  style = shape.labelup,   location = location.belowbar, color= color.green, textcolor = color.white, transp = 0, size = size.tiny)
plotshape(sat, title = "Sell", text = 'Sat', style = shape.labeldown, location = location.abovebar, color= color.red,   textcolor = color.white, transp = 0, size = size.tiny)

plotshape(hizlial,  title = "Hızlı Al",  text = 'Hızlı Al',  style = shape.labelup,   location = location.belowbar, color= color.blue, textcolor = color.white, transp = 0, size = size.tiny)
plotshape(hizlisat, title = "Hızlı Sat", text = 'Hızlı Sat', style = shape.labeldown, location = location.abovebar, color= #6106D6 , textcolor = color.white, transp = 0, size = size.tiny)

fill (alTrend, satTrend, color = sma7 >= sma25? #4DFF00 : #FF0C00, transp=80, title="Al-Sat Aralığı")
//fill (ort99, satTrend, color = sma7 >= sma25? #6106D6 : color.blue, transp=80, title="Hızlı Al-Sat Aralığı")

if (al)
    strategy.entry("LONG", strategy.long)
if (sat)
    strategy.entry("SHORT", strategy.short)
//if (hizlial)
//    strategy.entry("My Short Entry Id", strategy.long)
//if (hizlisat)
//    strategy.entry("My Short Entry Id", strategy.short)