EMA Oscillator Trend Following Strategy

Overview
This strategy uses the EMA indicator to identify price trends and combines standard deviation to calculate buy and sell signals for trend following trading. The main idea is to compute the difference between the close price and EMA, set a threshold to trigger orders.
Strategy Logic
The strategy first calculates the difference v between close price and EMA of length ema_length. Then it calculates the standard deviation dev of v over ema_length periods. Next it determines the direction coefficient k, with k=1 for long and k=-1 for short. The buy signal threshold dev_limit is calculated by k * dev * factor limit. When v crosses over dev_limit, a buy signal is triggered. The exit signal is when v crosses 0.
The strategy provides two modes:
-
Buy short, go long when v crosses below negative dev_limit, to follow a downtrend.
-
Buy long, go long when v crosses above positive dev_limit, to follow an uptrend.
In summary, the strategy dynamically calculates the standard deviation of the difference between price and EMA to set the threshold and follows trends. The factor controls the sensitivity of buy signals. ema_length determines the EMA period. The buy mode controls the order direction.
Advantage Analysis
The advantages of this strategy include:
-
EMA identifies trend direction well by smoothing prices.
-
Dynamic threshold based on standard deviation adapts better than fixed thresholds.
-
Two buy modes allow following uptrend or downtrend.
-
The factor provides flexibility in tuning buy sensitivity. ema_length allows EMA period optimization.
-
The logic is simple and easy to understand and modify.
-
Position sizing can be configured flexibly for aggressive trend following.
Risk Analysis
The risks of the strategy:
-
EMA has lag and may miss trend turning points.
-
It relies on parameter optimization. Improper settings lead to insufficient sensitivity or oversensitivity.
-
Trend following risks larger losses when trend reverses.
-
Frequent long/short switches increase trading frequency.
-
Frequent signals in ranging markets increase costs.
To address the risks, consider adding stop loss, optimizing parameters, adding filters to avoid overtrading, etc.
Optimization Directions
The strategy can be optimized by:
-
Testing different EMA periods to find the optimal length.
-
Testing different factor values to find the best sensitivity.
-
Optimizing position sizing strategies, e.g. pyramiding.
-
Adding filters to avoid wrong trades in choppy markets.
-
Incorporating stop loss to control single trade loss.
-
Optimizing parameters separately for the two buy modes.
-
Researching trend reversal signals to stop trend following.
Conclusion
The strategy identifies trends with EMA and generates dynamic threshold orders to follow trends. The logic is simple and clear. Position sizing can be aggressive for trend chasing. It has risks that need to be addressed through parameter optimization and stop loss. It serves as a good example to learn indicator combination and parameter tuning.
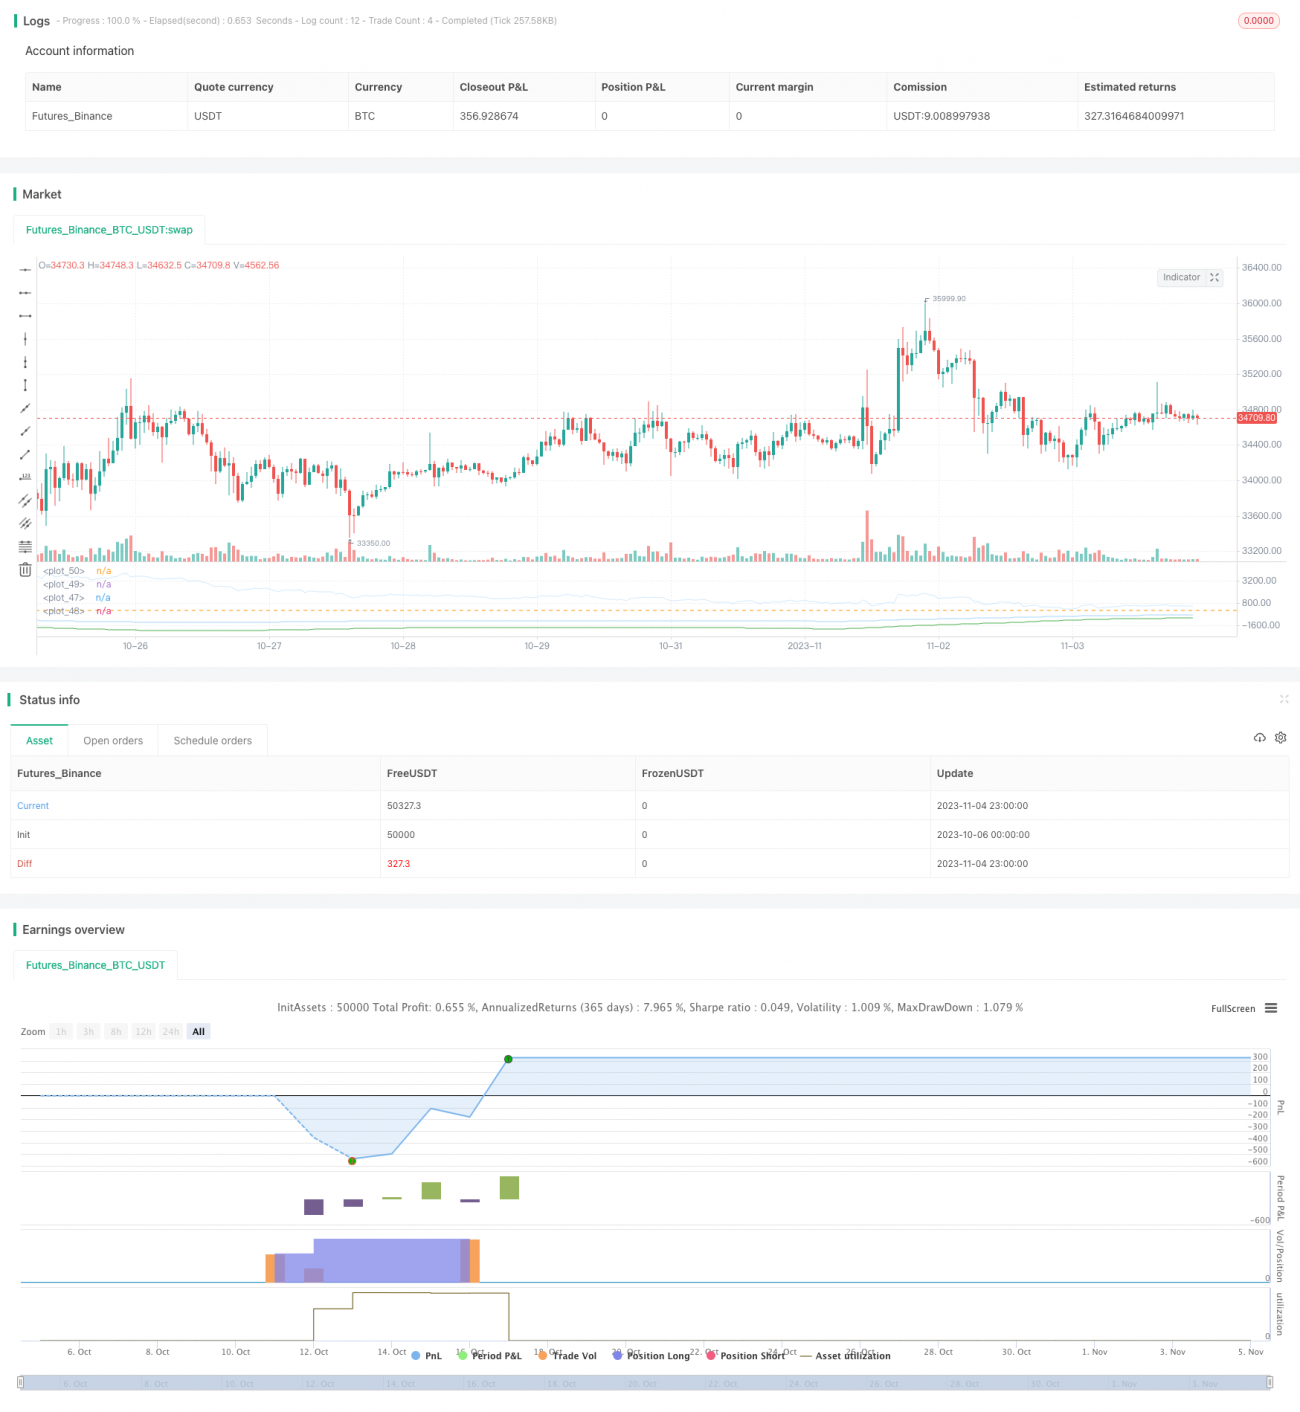
/*backtest
start: 2023-10-06 00:00:00
end: 2023-11-05 00:00:00
period: 1h
basePeriod: 15m
exchanges: [{"eid":"Futures_Binance","currency":"BTC_USDT"}]
*/

// This source code is subject to the terms of the Mozilla Public License 2.0 at https://mozilla.org/MPL/2.0/
// © Azzrael

// Based on EMA and EMA Oscilator https://www.tradingview.com/script/qM9wm0PW-EMA-Oscilator-Azzrael/- 1