Dual Laser Trend-seeking Strategy

Author: ChaoZhang, Date: 2023-11-06 10:01:42
Tags:

img

Overview

This strategy uses Bollinger Bands, Keltner Channels and Adaptive Relative Strength Index to determine the current trend direction, combined with Parabolic SAR to time the entry. Trading signals are generated when the judgments of these three indicators agree. The strategy mainly judges the trend direction and enters in a timely manner when the trend changes, aiming for profit.

Principles

This strategy combines the following three technical indicators to determine the current trend:

  1. SQUEEZE Momentum Indicator: Calculates Bollinger Bands and Keltner Channels. When the two bands overlap, it generates a squeeze and signals an impending trend change. It returns the squeeze status and linear regression slope.

  2. RSI Volume Weighted: Calculates RSI weighted by volume. Uses the midpoint to determine overbought/oversold levels. It emphasizes volume changes.

  3. Parabolic SAR: Judges the location of current price relative to the SAR line. SAR above price indicates downtrend while SAR below price indicates uptrend.

The strategy uses Bollinger Bands to determine trend direction, Keltner Channels to refine it, RSI to find reversal opportunities when overbought/oversold, and SAR to time the entry. The logic is:

  1. Calculate Bollinger Bands, Keltner Channels, Squeeze indicator. Enter standby when squeeze happens.

  2. Calculate volume weighted RSI. RSI above midpoint indicates uptrend, below midpoint downtrend.

  3. Calculate Parabolic SAR. SAR below price shows uptrend, above price shows downtrend.

  4. Combine the three indicators: when squeeze happens, RSI goes above midpoint, SAR is below price, a long signal is generated. When squeeze happens, RSI goes below midpoint, SAR is above price, a short signal is generated.

  5. When a signal is triggered, check if the judgments of the three indicators on the previous bar are the opposite of current signal. If so, enter trade.

  6. Set stop loss and take profit after entry, trailing stop loss.

Advantages

The advantages of this strategy:

  1. The combination of multiple indicators improves accuracy of trend judgment. Squeeze accurately detects trend changes, RSI clearly identifies overbought/oversold levels, SAR precisely times the entry.

  2. The indicator logic is simple and easy to understand.

  3. The confirmation of multiple indicators helps filter false breakouts.

  4. The stop loss and take profit mechanics lock in profits and limit risks.

  5. Extensive backtest data ensures reliability.

Risks

There are also some risks:

  1. The long and short entry logic is similar and may generate conflicting signals. Filtering is needed.

  2. All indicators use parameter optimization, risks overfitting.

  3. High trading frequency, position sizing needs control.

  4. Stop loss may be too close and get stopped out easily.

Solutions:

  1. Add persistence check on indicator judgments to avoid signal oscillation.

  2. Use walk forward analysis to adjust parameters and prevent overfitting.

  3. Set pyramiding size to control positions per direction.

  4. Test different stop loss ranges to optimize stop loss price.

Optimization Directions

Some directions to optimize the strategy:

  1. Optimize indicator parameters for stability. Consider dynamic optimization.

  2. Add position sizing logic like fixed/equal percentage.

  3. Test different stop loss methods like volatility or linear stops, zeroing positions etc.

  4. Add money management like fixed fractional position sizing.

  5. Use machine learning models for dynamic entry and exit.

  6. Add hedging mechanisms by going both long and short to reduce correlated systemic risks.

  7. Consider more indicators and build voting mechanisms to improve accuracy.

Conclusion

The strategy has clear logic of using multiple indicators to determine trend direction and astutely entering on squeeze. The stop loss and take profit mechanics limit risks. Parameter optimization and risk controls can further improve backtest and live results. It is a stable trend following strategy suitable for trending products, and can also work on larger timeframes like daily. With strong practical value, this strategy can be further optimized in many aspects.
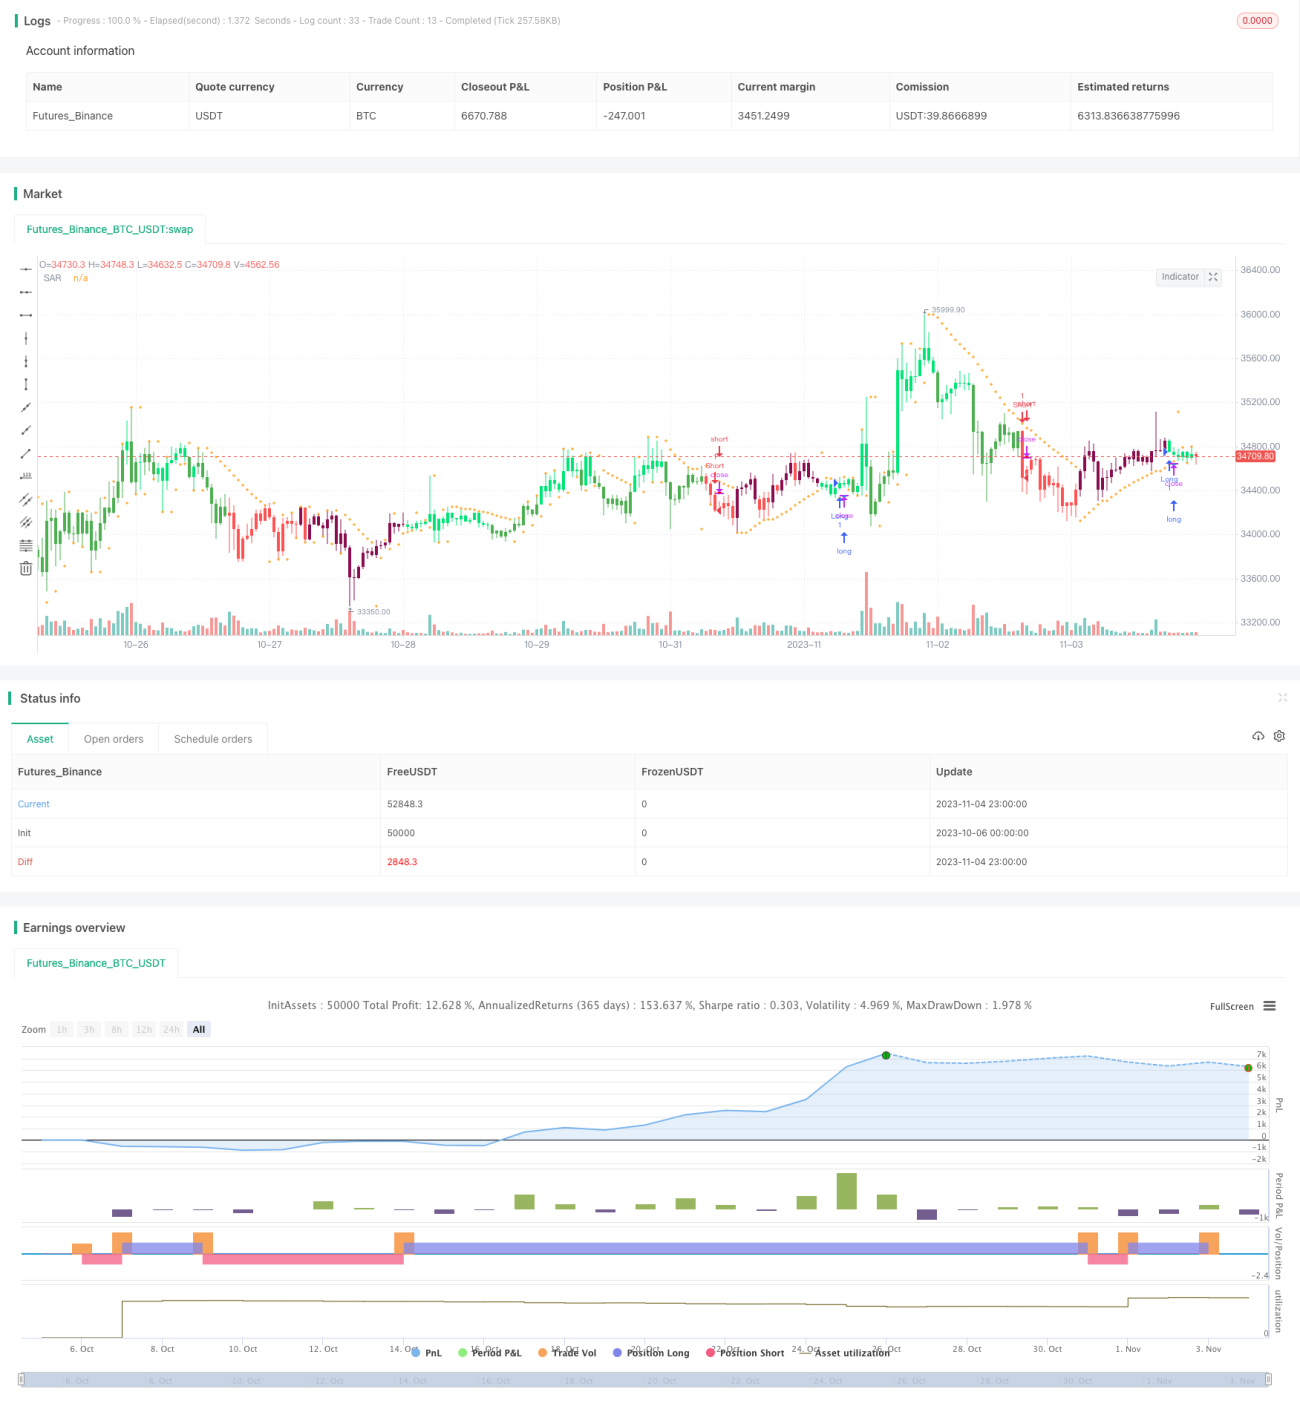

/*backtest
start: 2023-10-06 00:00:00
end: 2023-11-05 00:00:00
period: 1h
basePeriod: 15m
exchanges: [{"eid":"Futures_Binance","currency":"BTC_USDT"}]
*/

// This source code is subject to the terms of the Mozilla Public License 2.0 at https://mozilla.org/MPL/2.0/
// © XaviZ

//#####©ÉÉÉɶN###############################################
//####*..´´´´´´,,,»ëN########################################
//###ë..´´´´´´,,,,,,''%©#####################################
//###'´´´´´´,,,,,,,'''''?¶###################################
//##o´´´´´´,,,,,,,''''''''*©#################################
//##'´´´´´,,,,,,,'''''''^^^~±################################
//#±´´´´´,,,,,,,''''''''^í/;~*©####æ%;í»~~~~;==I±N###########
//#»´´´´,,,,,,'''''''''^;////;»¶X/í~~/~~~;=~~~~~~~~*¶########
//#'´´´,,,,,,''''''''^^;////;%I^~/~~/~~~=~~~;=?;~~~~;?ë######
//©´´,,,,,,,''''''''^^~/////X~/~~/~~/~~»í~~=~~~~~~~~~~^;É####
//¶´,,,,,,,''''''''^^^;///;%;~/~~;í~~»~í?~?~~~?I/~~~~?*=íÑ###
//N,,,,,,,'''''''^^^^^///;;o/~~;;~~;£=»í»;IX/=~~~~~~^^^^'*æ##
//#í,,,,,''''''''^^^^^;;;;;o~»~~~~íX//~/»~;í?IíI»~~^/*?'''=N#
//#%,,,'''''''''^^^^^^í;;;;£;~~~//»I»/£X/X/»í*&~~~^^^^'^*~'É#
//#©,,''''''''^^^^^^^^~;;;;&/~/////*X;í;o*í»~=*?*===^'''''*£#
//##&''''''''^^^^^^^^^^~;;;;X=í~~~»;;;/~;í»~»±;^^^^^';=''''É#
//##N^''''''^^^^^^^^^^~~~;;;;/£;~~/»~~»~~///o~~^^^^''''?^',æ#
//###Ñ''''^^^^^^^^^^^~~~~~;;;;;í*X*í»;~~IX?~~^^^^/?'''''=,=##
//####X'''^^^^^^^^^^~~~~~~~~;;íííííí~~í*=~~~~Ií^'''=''''^»©##
//#####£^^^^^^^^^^^~~~~~~~~~~~íííííí~~~~~*~^^^;/''''='',,N###
//######æ~^^^^^^^^~~~~~~~~~~~~~~íííí~~~~~^*^^^'=''''?',,§####
//########&^^^^^^~~~~~~~~~~~~~~~~~~~~~~~^^=^^''=''''?,íN#####
//#########N?^^~~~~~~~~~~~~~~~~~~~~~~~~^^^=^''^?''';í@#######
//###########N*~~~~~~~~~~~~~~~~~~~~~~~^^^*'''^='''/É#########
//##############@;~~~~~~~~~~~~~~~~~~~^^~='''~?'';É###########
//#################É=~~~~~~~~~~~~~~^^^*~'''*~?§##############
//#####################N§£I/~~~~~~»*?~»o§æN##################

//@version=4
strategy(title="M-SQUEEZE", overlay = true)

//study(title="M-SQUEEZE", overlay = true)

src = input(close, "SOURCE", type = input.source)

// ███▓▒░░ VARIABLES ░░▒▓███

var bool longCond = na, var bool shortCond = na
var int CondIni_long0 = 0, var int CondIni_short0 = 0
var int CondIni_long = 0, var int CondIni_short = 0
var float last_open_longCondition = na, var float last_open_shortCondition = na
var int last_longCondition0 = na, var int last_shortCondition0 = na
var int last_longCondition = na, var int last_shortCondition = na
var bool long_tp = na, var bool short_tp = na
var int last_long_tp = na, var int last_short_tp = na
var bool Final_Long_tp = na, var bool Final_Short_tp = na
var bool SMI_longCond = na, var bool SMI_shortCond = na
var bool RSI_longCond = na, var bool RSI_shortCond = na
var bool ADX_longCond = na, var bool ADX_shortCond = na
var bool SAR_longCond = na, var bool SAR_shortCond = na
var bool Final_longCondition0 = na, var bool Final_shortCondition0 = na
var bool Final_longCondition = na, var bool Final_shortCondition = na

// ███▓▒░░ SQUEEZE MOMENTUM INDICATOR ░░▒▓███

Act_SMI = input(true, "SQUEEZE MOMENTUM INDICATOR")
BB_length = input(85, title="BOLLINGER BANDS LENGTH", minval = 1)
BB_mult = input(2.1, title="BOLLINGER BANDS MULTI-FACTOR", minval = 0.1, step = 0.1)
KC_length = input(38, title="KELTNER CHANNEL LENGTH", minval = 1)
KC_mult = input(2.0, title="KELTNER CHANNEL MULTI-FACTOR", minval = 0.1, step = 0.1)

SQUEEZE_M(_src,_BB_length,_BB_mult,_KC_length,_KC_mult)=>

    // Calculate BB
    basis = sma(_src, _BB_length)
    dev = _BB_mult * stdev(_src, _BB_length)
    upperBB = basis + dev
    lowerBB = basis - dev
    // Calculate KC
    ma = sma(src, _KC_length)
    rangema = sma(tr, _KC_length)
    upperKC = ma + rangema * _KC_mult
    lowerKC = ma - rangema * _KC_mult
    // Squeeze
    sqzOn = lowerBB > lowerKC and upperBB < upperKC
    sqzOff = lowerBB < lowerKC and upperBB > upperKC
    nosqz = sqzOn == false and sqzOff == false
    // Linear Regression curve
    val = linreg(_src - avg(avg(highest(high, _KC_length), lowest(low, _KC_length)), sma(close, _KC_length)), _KC_length, 0)
    [nosqz,val]
    
[NOSQZ,VAL] = SQUEEZE_M(src,BB_length,BB_mult,KC_length,KC_mult)

barcolor(iff(VAL > 0, iff(VAL > nz(VAL[1]), color.lime, color.green), iff(VAL < nz(VAL[1]), color.red, color.maroon)))

// ███▓▒░░ SAR ░░▒▓███

Act_SAR = input(true, "PARABOLIC SAR")
Sst = input (0.73, "SAR STAR", step=0.01, minval = 0.01)
Sinc = input (0.5, "SAR INC", step=0.01, minval = 0.01)
Smax = input (0.06, "SAR MAX", step=0.01, minval = 0.01)

SAR = sar(Sst, Sinc, Smax)
plot(SAR, style = plot.style_cross, title = "SAR")

// ███▓▒░░ RSI VOLUME WEIGHTED ░░▒▓███

Act_RSI = input(true, "RSI VOLUME WEIGHTED")
RSI_len = input(22, "RSI LENGHT", minval = 1)
RSI_obos = input(45,title="RSI CENTER LINE", type=input.integer, minval = 1)

WiMA(_src, _length)=> 
    var float MA_s=0.0
    MA_s:=(_src + nz(MA_s[1] * (_length-1)))/_length
    MA_s

RSI_Volume(fv, length)=>	
	up=iff(fv>fv[1],abs(fv-fv[1])*volume,0)
	dn=iff(fv<fv[1],abs(fv-fv[1])*volume,0)
	upt=WiMA(up,length)
	dnt=WiMA(dn,length)
	100*(upt/(upt+dnt))

RSI_V = RSI_Volume(src, RSI_len)

// ███▓▒░░ STRATEGY ░░▒▓███

SMI_longCond := (Act_SMI ? (VAL > 0 and (VAL > nz(VAL[1])) and not NOSQZ) : RSI_longCond) 
RSI_longCond := (Act_RSI ? (RSI_V > RSI_obos) : SAR_longCond)
SAR_longCond := (Act_SAR ? (SAR < close) : SMI_longCond)

SMI_shortCond := (Act_SMI ? (VAL < 0 and (VAL < nz(VAL[1])) and not NOSQZ) : RSI_shortCond) 
RSI_shortCond := (Act_RSI ? (RSI_V < RSI_obos) : SAR_shortCond)
SAR_shortCond := (Act_SAR ? (SAR > close) : SMI_shortCond)

longCond := SMI_longCond and RSI_longCond and SAR_longCond
shortCond := SMI_shortCond and RSI_shortCond and SAR_shortCond

CondIni_long0 := longCond ? 1 : shortCond ? -1 : CondIni_long0[1]
CondIni_short0 := longCond ? 1 : shortCond ? -1 : CondIni_short0[1]

longCondition0 = (longCond and CondIni_long0[1] == -1)
shortCondition0 = (shortCond and CondIni_short0[1] == 1)

CondIni_long := longCond[1] ? 1 : shortCond[1] ? -1 : CondIni_long[1]
CondIni_short := longCond[1] ? 1 : shortCond[1] ? -1 : CondIni_short[1]

longCondition = (longCond[1] and CondIni_long[1] == -1)
shortCondition = (shortCond[1] and CondIni_short[1] == 1)

// ███▓▒░░ ALERTS & SIGNALS ░░▒▓███

plotshape(longCondition, title = "Long Signal", style = shape.triangleup, location = location.belowbar, color = color.blue, transp = 0, size = size.tiny)
plotshape(shortCondition, title = "Short Signal", style = shape.triangledown, location = location.abovebar, color = #FF0000, transp = 0, size = size.tiny)

//alertcondition(longCondition, title="Long Alert", message = "LONG") 
//alertcondition(shortCondition, title="Short Alert", message = "SHORT")

// ███▓▒░░ BACKTESTING ░░▒▓███

testStartYear = input(2018, "BACKTEST START YEAR", minval = 1980, maxval = 2222) 
testStartMonth = input(01, "BACKTEST START MONTH", minval = 1, maxval = 12)
testStartDay = input(01, "BACKTEST START DAY", minval = 1, maxval = 31)
testPeriodStart = timestamp(testStartYear,testStartMonth,testStartDay,0,0)
testStopYear = input(2222, "BACKTEST STOP YEAR", minval=1980, maxval = 2222)
testStopMonth = input(12, "BACKTEST STOP MONTH", minval=1, maxval=12)
testStopDay = input(31, "BACKTEST STOP DAY", minval=1, maxval=31)
testPeriodStop = timestamp(testStopYear, testStopMonth, testStopDay, 0, 0)

testPeriod = time >= testPeriodStart and time <= testPeriodStop ? true : false

strategy.entry("Long", strategy.long, when = longCondition0 and testPeriod)
strategy.entry("Short", strategy.short, when = shortCondition0 and testPeriod)


More