概述
基于ROC的RSI交易策略是一种新型的交易策略,它将经典的RSI指标与ROC指标相结合,形成一个全新的交易指标——RSI/ROC。该策略利用ROC来计算RSI,从而过滤掉价格的部分噪音,使RSI指标更稳定可靠。
策略原理
该策略的核心指标是RSI/ROC,它是在ROC指标的基础上计算RSI的值。ROC指标可以显示当前价格与X周期前价格的变化差值,以点数或百分比表示。而RSI指标反映的是一段时间内涨价天数与跌价天数的比值,用来判断超买超卖。
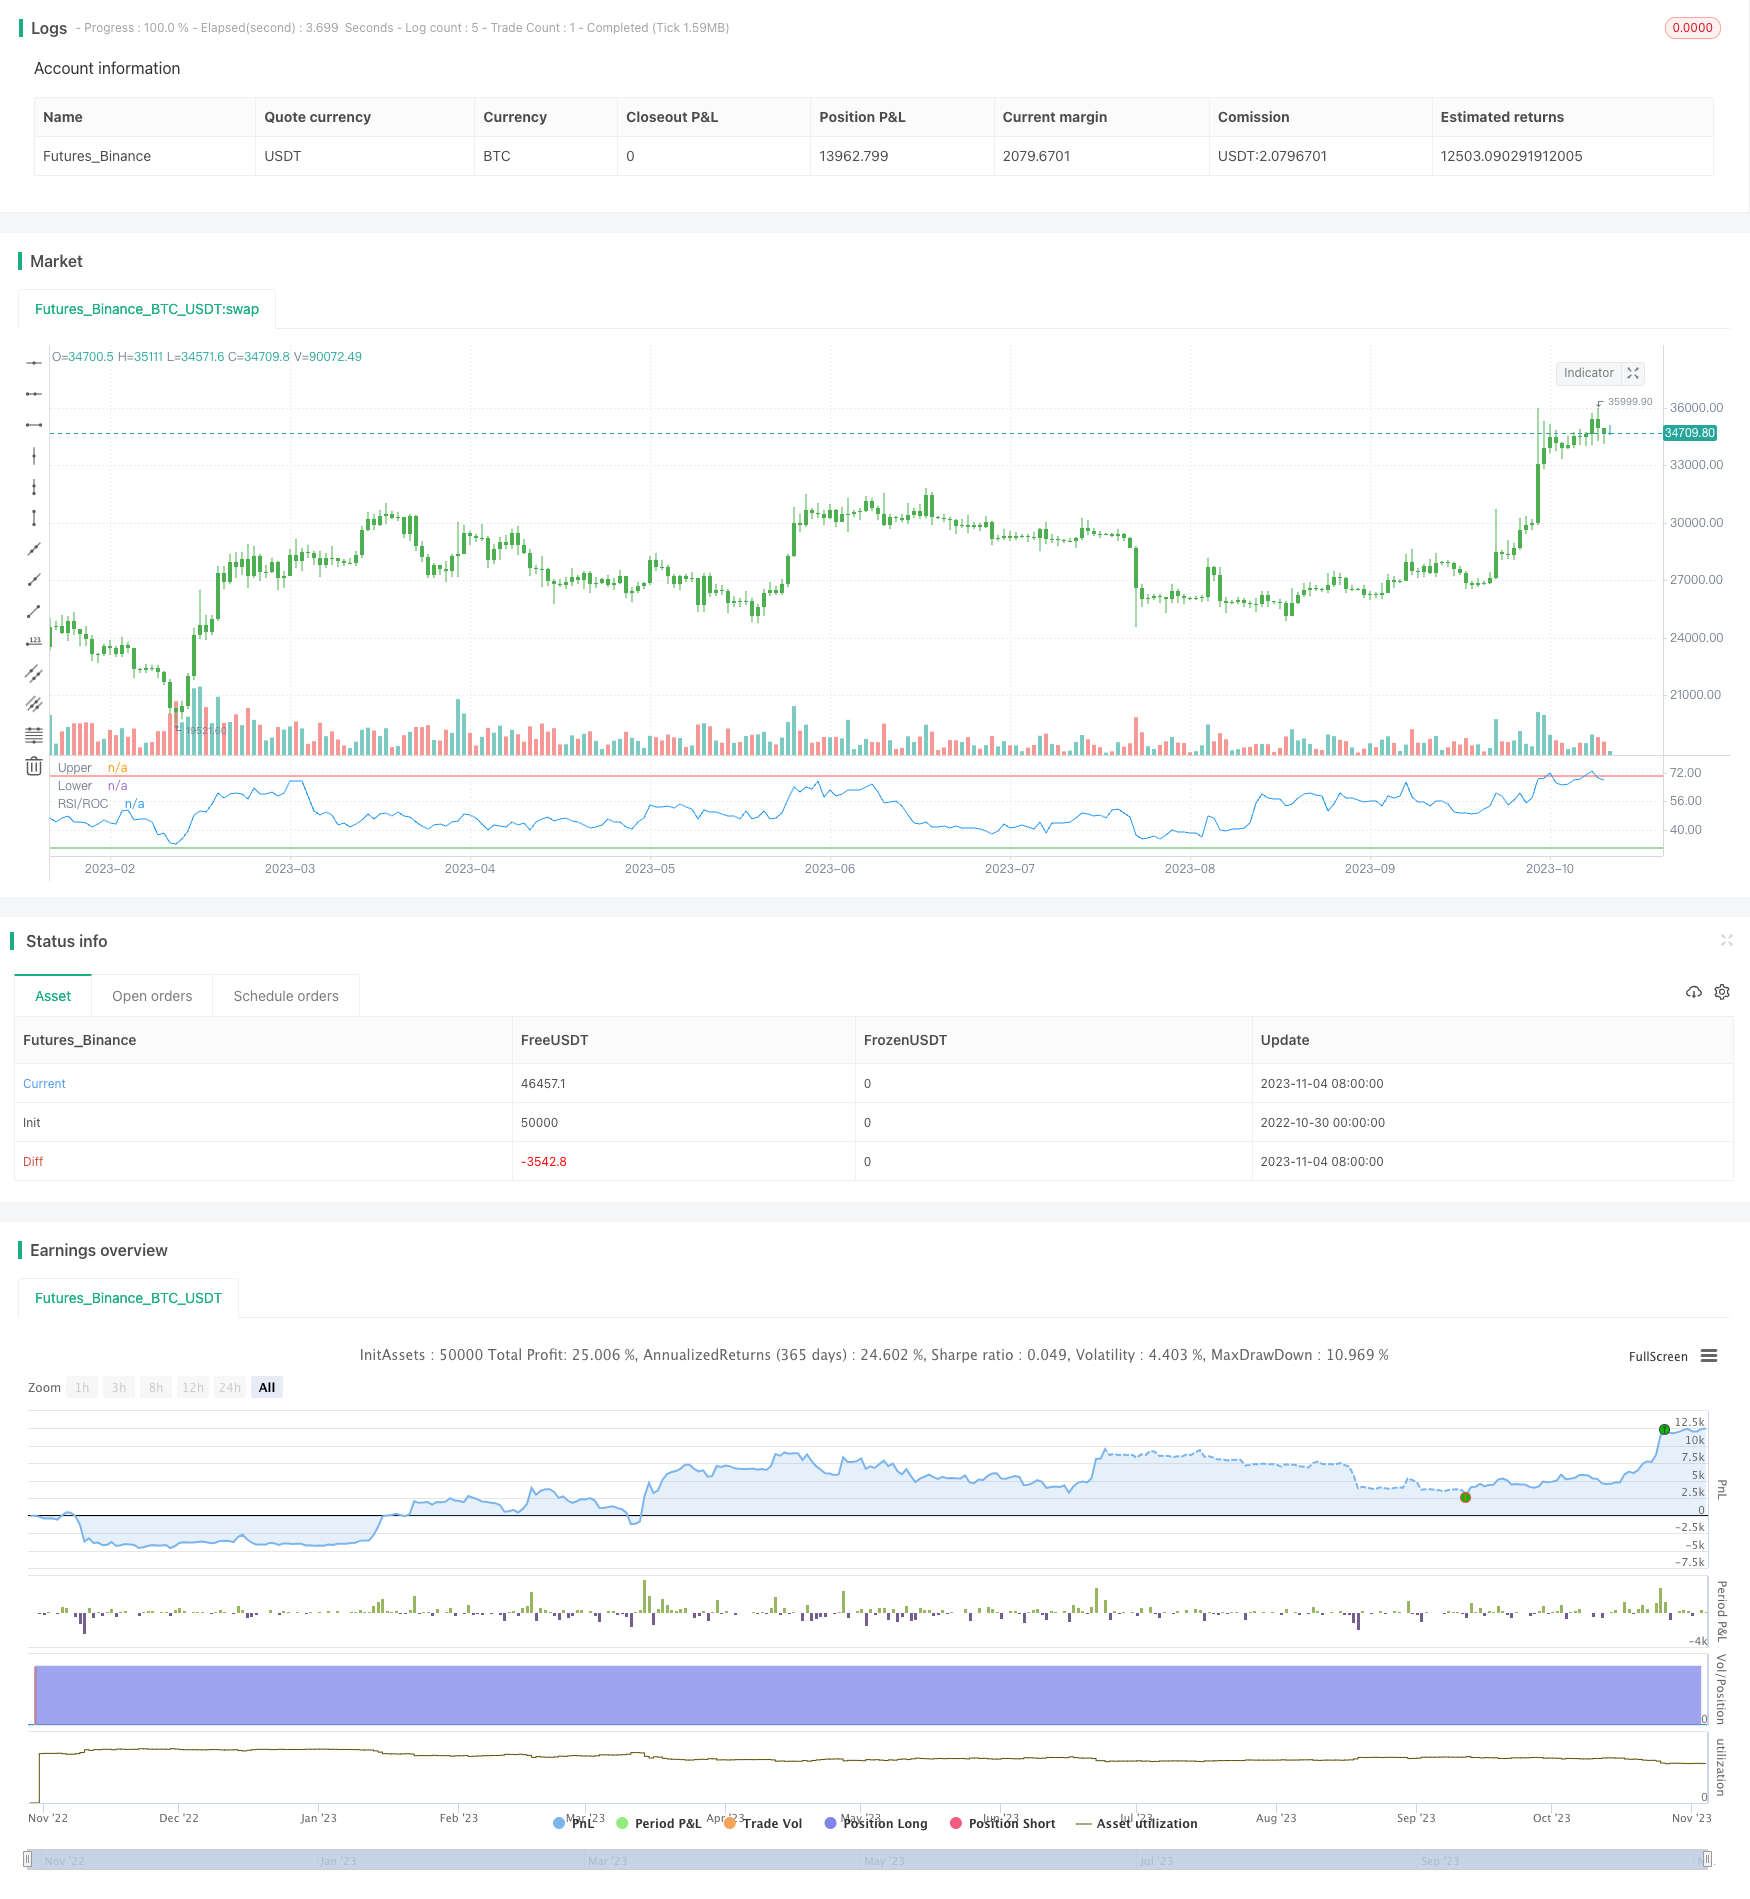
RSI/ROC指标将二者相结合,先通过ROC计算价格变化速度,然后基于ROC结果计算RSI,可以更好地反映价格的内在涨落态势。当RSI/ROC低于30时为超卖区,高于70时为超买区,可以进行反向操作。
该策略还设置了买入区和卖出区划分指标值高低的界限,开启反向交易时,会进行反向操作。对指标值设置不同颜色的可视化样式。
优势分析
ROC指标可以过滤价格数据中的部分噪音,RSI/ROC指标更稳定可靠。
结合买入区和卖出区设置,可以更清晰判断超买超卖现象。
开启反向交易功能,可以用于两种不同的交易方式。
可视化指标样式,使指标易于判断和使用。
RSI/ROC指标参数可自定义设置,适用于不同市场环境。
风险分析
如其他技术指标,该策略也可能出现误报的情况。
RSI/ROC指标因参考ROC,对突发重大消息反应可能有滞后。
买入区和卖出区的设定若不当,可能错过交易机会或增加不必要交易。
反向交易模式下,需警惕趋势反转的风险。
参数设置不当时,会产生多余平仓或重新入场现象。
可适当结合其他指标判断,规避部分风险。优化参数设置,使之符合不同交易品种。
优化方向
结合移动平均线等指标,识别趋势方向,避免逆势交易。
优化RSI长度和ROC长度参数的设置,使其更符合具体交易品种的特点。
调整买入区和卖出区参数,使其能捕捉重要的超买超卖信号。
加入止损策略,控制单笔损失。
可以考虑只在趋势行情下使用该策略,而在盘整时暂停。
总结
基于ROC的RSI交易策略,将ROC指标和RSI指标进行了创新结合,形成了新的RSI/ROC指标。该指标能有效过滤价格数据噪音,判断超买超卖情况。在参数优化和风险控制到位后,其可靠性和适用范围会更广。该策略既保留了RSI的优势,又增强了ROC的趋势判断能力,是一种可靠且可自定义的交易策略。
/*backtest
start: 2022-10-30 00:00:00
end: 2023-11-05 00:00:00
period: 1d
basePeriod: 1h
exchanges: [{"eid":"Futures_Binance","currency":"BTC_USDT"}]
*/

//@version=2
////////////////////////////////////////////////////////////
//  Copyright by HPotter v1.0 31/10/2017
// This is the new-age indicator which is version of RSI calculated upon
// the Rate-of-change indicator.
// The name "Relative Strength Index" is slightly misleading as the RSI
// does not compare the relative strength of two securities, but rather
// the internal strength of a single security. A more appropriate name
// might be "Internal Strength Index." Relative strength charts that compare
// two market indices, which are often referred to as Comparative Relative Strength.
// And in its turn, the Rate-of-Change ("ROC") indicator displays the difference
// between the current price and the price x-time periods ago. The difference can
// be displayed in either points or as a percentage. The Momentum indicator displays
// the same information, but expresses it as a ratio.
//
// You can change long to short in the Input Settings
// WARNING:
// - For purpose educate only
// - This script to change bars colors.
///////////////////////////////////////////////////////////
strategy(title="RSI based on ROC", shorttitle="RSI/ROC")
RSILength = input(20, minval=1)
ROCLength = input(20, minval=1)
BuyZone = input(30, minval=1)
SellZone = input(70, minval=1)
reverse = input(false, title="Trade reverse")
xPrice = close
hline(SellZone, color=red, linestyle=line, title = "Upper")
hline(BuyZone, color=green, linestyle=line, title = "Lower")
nRes = rsi(roc(xPrice,ROCLength),RSILength)
pos = iff(nRes < BuyZone, -1,
	   iff(nRes > SellZone, 1, nz(pos[1], 0)))
possig = iff(reverse and pos == 1, -1,
          iff(reverse and pos == -1, 1, pos))
if (possig == 1)
    strategy.entry("Long", strategy.long)
if (possig == -1)
    strategy.entry("Short", strategy.short)
barcolor(possig == -1 ? red: possig == 1 ? green : blue )
plot(nRes, color=blue, title="RSI/ROC")