Momentum Integral Indicator Strategy

Overview
This strategy generates trading signals by calculating the sum of differences between ROC and SMA. It belongs to short-term trading strategies.
Strategy Logic
The strategy first calculates SMA with length l and ROC. Then it calculates the difference k between close price and SMA. Next it sums up k for s days and gets sum. When sum>0, it goes long. When sum<0, it goes short.
Specifically, in the code:
-
Calculate SMA with length l, get a.
-
Calculate ROC with length l, get r.
-
Calculate difference between close price and SMA: k = close - a.
-
Sum up k for s days, get sum.
-
If sum>0, long position; if sum<0, short position.
-
Exit when sum<0 for long, and sum>0 for short.
The key is to sum up the difference k and use the sign of sum for trading signals. When k>0 for recent days, price is increasing, so go long. When k<0, price is decreasing, so go short.
Advantage Analysis
This simple short-term trading strategy has the following advantages:
-
The indicators used are simple and easy to understand.
-
Filtering by the difference of indicators can find more accurate trading opportunities.
-
Summing up the difference can better capture short-term trends.
-
The parameters l and s can be adjusted for different cycle.
-
The logic is clear and easy to modify and optimize.
-
High capital utilization efficiency for frequent short-term trading.
Risk Analysis
There are also some risks:
-
Higher risks in short-term trading, losses are possible.
-
Improper parameters may lead to over-trading or missing opportunities.
-
Hard to adapt to trend reversal, no stop loss may lead to big losses.
-
Frequent adjustment of parameters relies heavily on trader's experience.
-
High trading frequency may increase transaction costs and slippage.
Solutions:
-
Adjust parameters properly to lower trading frequency.
-
Add trend indicators to identify reversals.
-
Optimize stop loss to control single trade loss.
-
Add auto parameter optimization to lower dependence on experience.
-
Optimize order execution model to lower transaction costs.
Optimization Directions
The strategy can be further optimized in the following aspects:
-
Optimize parameter calculation methods, like genetic algorithms, to make parameters adaptive.
-
Add more indicators and filters to improve signal quality.
-
Improve stop loss strategy, like trailing stop loss.
-
Optimize money management strategies like risk point control.
-
Optimize order execution model with trend following, slippage control etc.
-
Add backtesting and auto optimization modules.
-
Add quantitative evaluation of signal quality.
With these optimizations, this strategy can become a more comprehensive, intelligent, stable and controllable short-term trading system.
Summary
In summary, this strategy generates simple signals from indicators, with clear logic and easy implementation. With further optimizations in parameters, stop loss, money management etc., it can become a worthwhile quantitative trading strategy. But no strategy is perfect. Traders still need to apply it rationally based on personal risk preference.
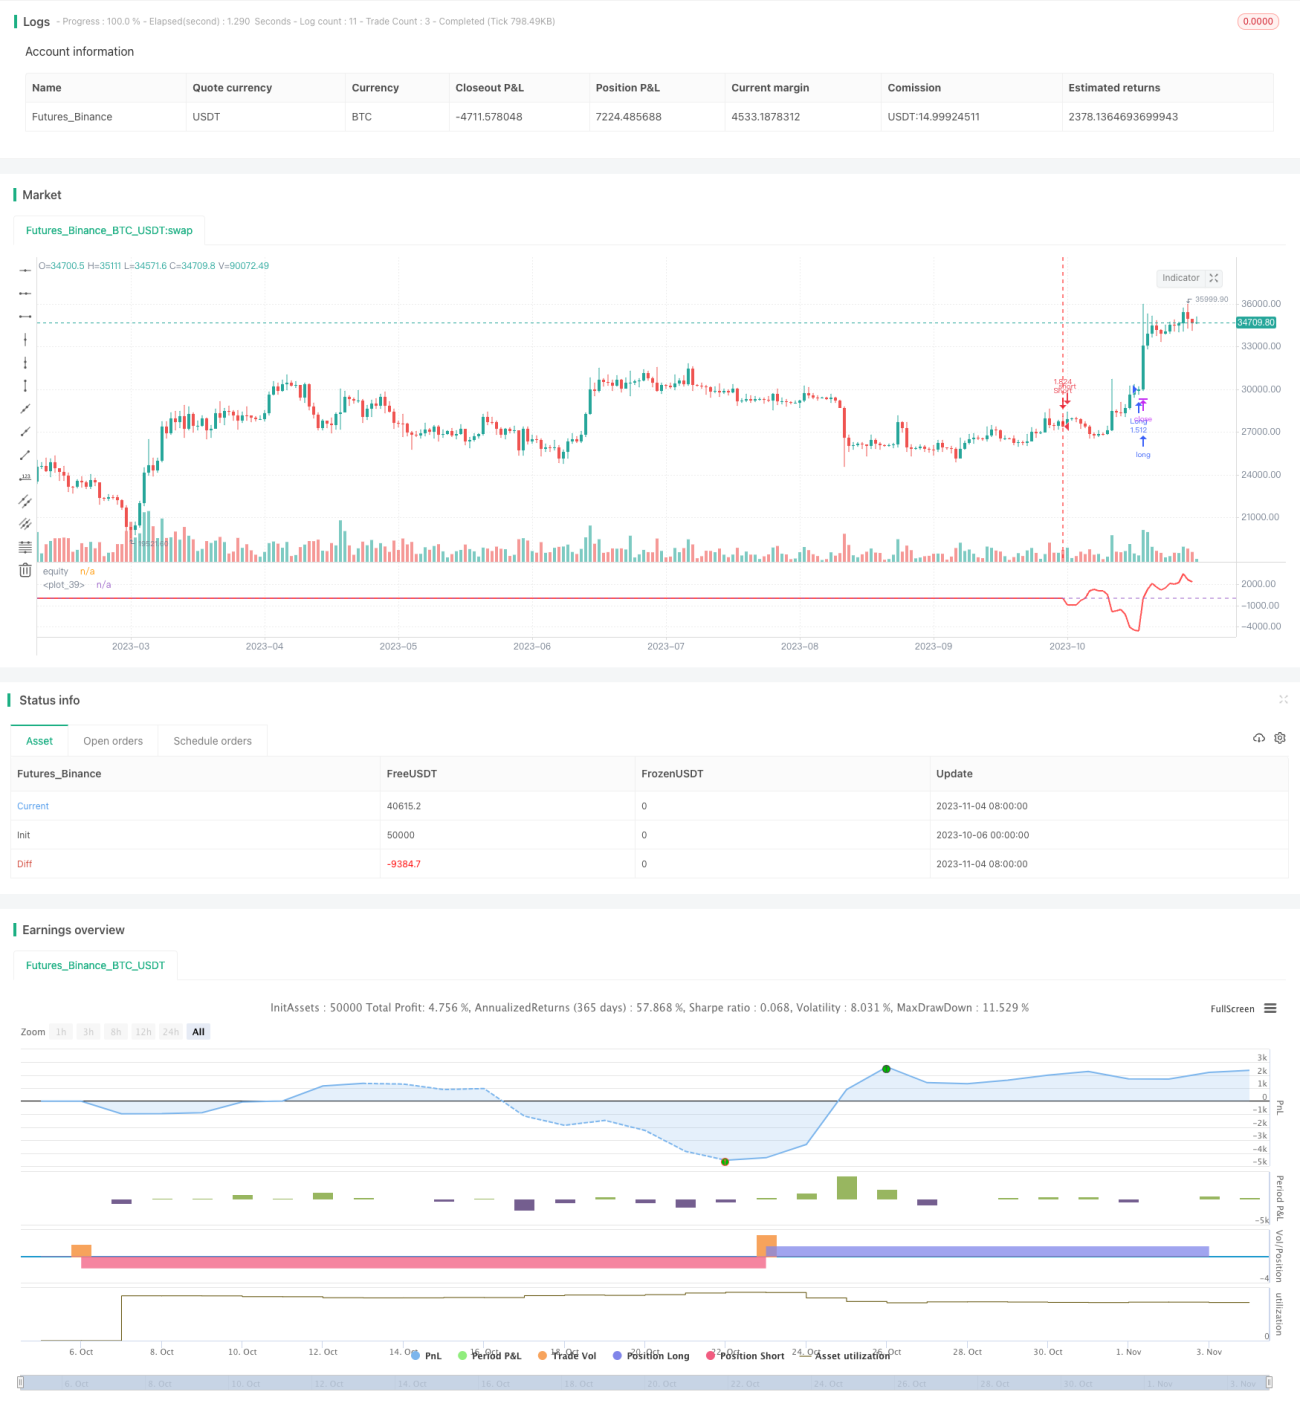
/*backtest
start: 2023-10-06 00:00:00
end: 2023-11-05 00:00:00
period: 1d
basePeriod: 1h
exchanges: [{"eid":"Futures_Binance","currency":"BTC_USDT"}]
*/

//@version=2
strategy("Indicator Integrator Strat",default_qty_type = strategy.percent_of_equity, default_qty_value = 100,currency="USD",initial_capital=662, overlay=false)

l = input(defval=170,title="Length for indicator")- 1