EMAC Exponential Moving Average Cross Optimized Strategy

Overview
The EMAC Exponential Moving Average Cross Optimized Strategy is an optimized version based on the basic EMAC strategy. It incorporates trend judgment, multiple moving average filtering, and stop loss/take profit exits, aiming to follow mid-to-long term trends.
Strategy Logic
-
Judge recent trend direction: calculate the increase/decrease percentage of close price over past 26 weeks to determine uptrend, downtrend or sideways.
-
Multiple moving average filter: calculate 10-period, 20-period, 34-period EMA and wait for them to cross above 50-period SMA to trigger buy signals.
-
ATR stop loss: when entry signal appears, set stop loss at entry bar's low or high minus 2.5ATR.
-
Trailing stop loss: gradually move up stop loss line as price rises.
-
Take profit: when entry signal appears, set target at close price plus 3ATR.
-
MA pullback exit: actively exit when price breaks back below 10-day EMA.
Advantages
-
Multiple MA filter increases signal reliability, avoiding false breakouts.
-
ATR stop loss allows reasonable stop distance based on market volatility.
-
Trailing stop locks in some profits as it moves up.
-
Reasonable profit target avoids giving back too much profit.
-
MA pullback exit allows timely exit when trend reverses.
Risks and Solutions
-
EMA crosses may whipsaw in sideways markets, causing consecutive losses. Can increase EMA periods or add MA crossover filter.
-
Large ATR values can cause stops too far away, increasing loss risk. Can optimize with ATR moving averages or reduction coefficients.
-
Overnight gap risk not considered. Can add logic to avoid signals during non-trading periods.
-
Market regime not considered. Can add market trend filter as a strategy switch.
Optimization Directions
-
Test EMA combinations to find optimal lengths for different products.
-
Test ATR moving averages or reduction coefficients to optimize stop distance.
-
Add logic to avoid signals during non-trading periods.
-
Add market trend filter as a strategy switch when market is unfavorable.
-
Backtest parameter combinations over many years to find optimal stability.
Summary
The EMAC Exponential Moving Average Cross Optimized Strategy combines trend judgment, multiple MA filtering and dynamic stops to follow mid-to-long term trends. Compared to the original version it has undergone parameter optimization to improve real-trading performance. But further optimizations and enhancements are needed by adding more logic to handle different market situations, reducing risks and improving stability and profitability.
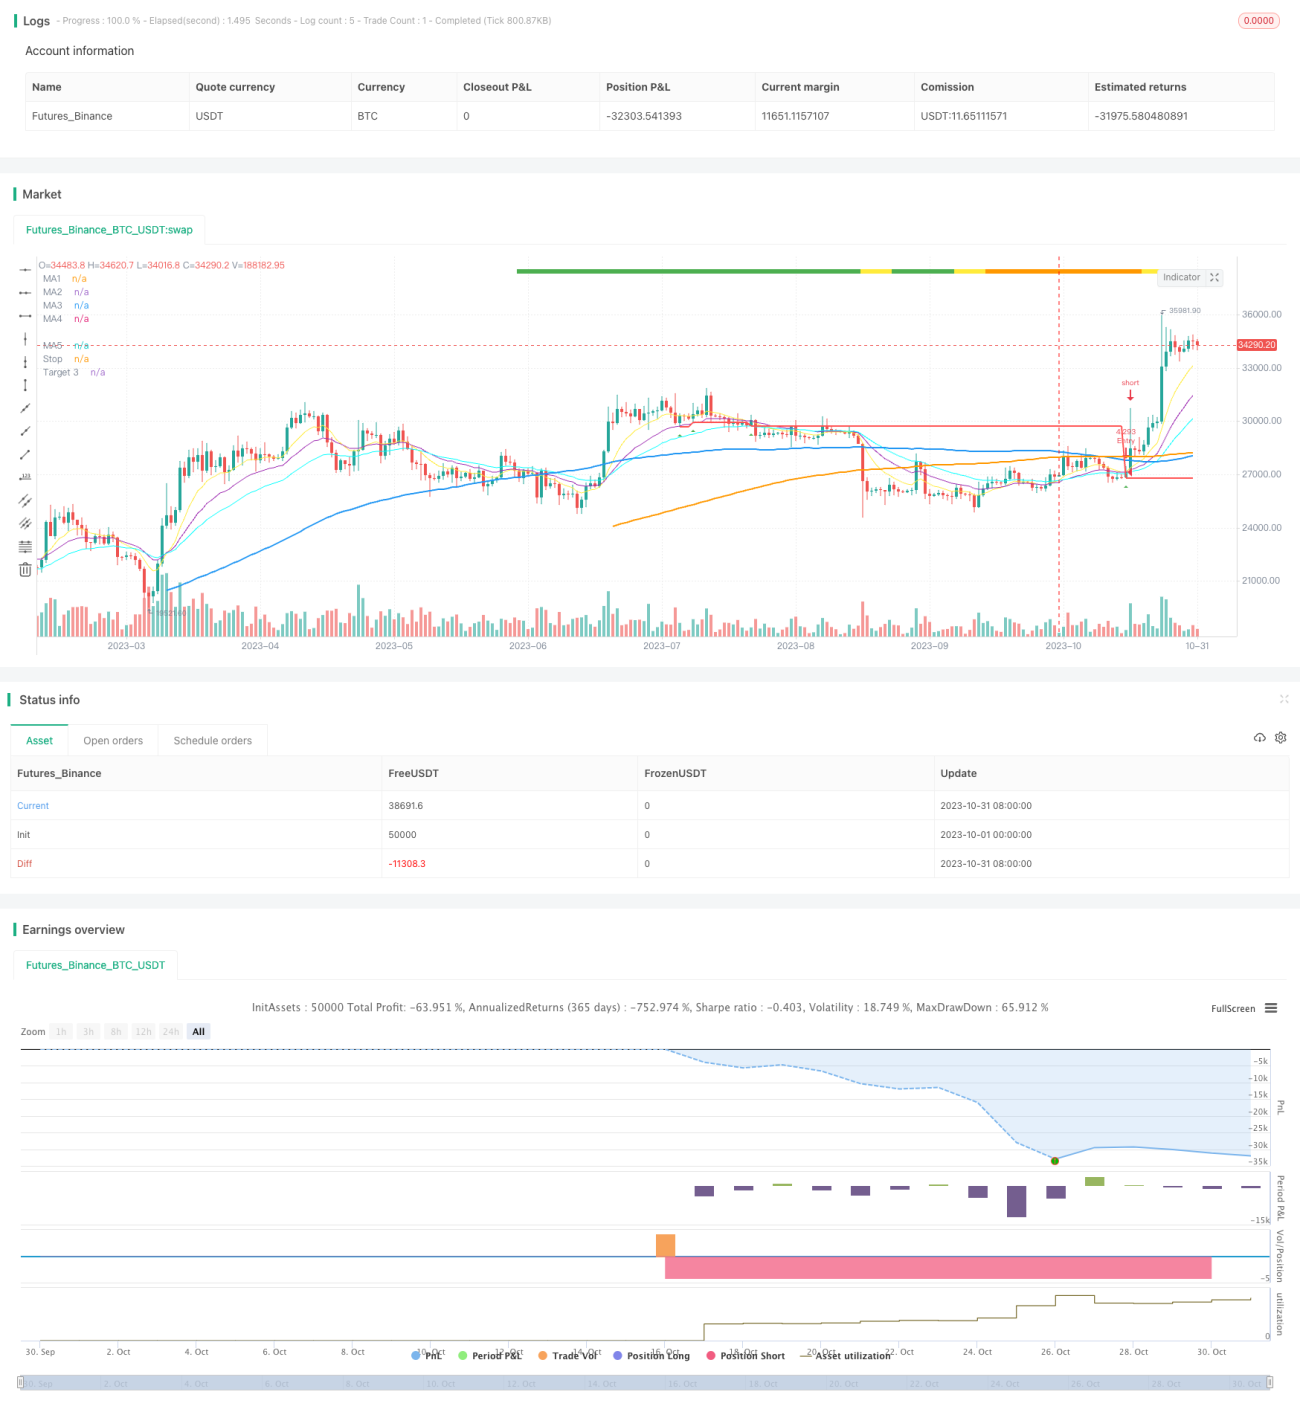
/*backtest
start: 2023-10-01 00:00:00
end: 2023-10-31 23:59:59
period: 1d
basePeriod: 1h
exchanges: [{"eid":"Futures_Binance","currency":"BTC_USDT"}]
*/

//@version=4
//Author = Dustin Drummond https://www.tradingview.com/u/Dustin_D_RLT/
//Strategy based in part on original 10ema Basic Swing Trade Strategy by Matt Delong: https://www.tradingview.com/u/MattDeLong/
//Link to original 10ema Basic Swing Trade Strategy: https://www.tradingview.com/script/8yhGnGCM-10ema-Basic-Swing-Trade-Strategy/- 1