Trend Reversal and Ehlers Leading Indicator Combo Strategy

Overview
This strategy combines a trend reversal strategy and an Ehlers leading indicator strategy to generate more reliable trading signals. The trend reversal strategy identifies trend reversal points while the Ehlers leading indicator strategy identifies cyclical turning points. The combined signals can better determine market entry timing.
Strategy Logic
Trend Reversal Strategy
This strategy is from the book "How I Tripled My Money in the Futures Market" by Ulf Jensen, page 183. It is a reversal type strategy. It goes long when the close is higher than the previous close for 2 consecutive days and the 9-day Stochastic slow line is below 50. It goes short when the close is lower than the previous close for 2 consecutive days and the 9-day Stochastic fast line is above 50.
Ehlers Leading Indicator Strategy
This strategy plots a single daily detrended synthetic price (DSP) and a daily Ehlers leading indicator (ELI) using intraday data. DSP captures the dominant cycle of price and is computed by subtracting a 3-pole Butterworth filter from a 2-pole filter. ELI gives advanced indication of cyclic turning points and is computed by subtracting the simple moving average of DSP from DSP itself. Buy and sell signals are generated when ELI crosses over or under DSP.
Advantage Analysis
The biggest advantage of this combo strategy is combining trend reversal identification and cyclical turning point detection for more reliable signals. The trend reversal strategy identifies reversals after breakouts while the Ehlers leading indicator provides early indication of cyclic lows and highs. Combining the two can better pinpoint market entry.
Another advantage is the flexibility in parameter tuning. The parameters of the stochastic indicator can be adjusted based on market conditions. The cycle length for the Ehlers leading indicator is also adjustable for different cycles.
Risk Analysis
The biggest risk of this strategy is missing persisting trends. Since the strategy waits for reversal signals to enter, it may miss strong early trend moves. Reversal signals may also turn out to be false breakouts resulting in being trapped.
The solutions are to adjust parameters to shorten the reversal detection period for timely trend reversal capture. Stop loss can also be introduced to control losses.
Optimization Directions
The strategy can be improved in the following aspects:
-
Introduce stop loss to control single trade loss.
-
Optimize parameters to adjust reversal signal periods for different market environments.
-
Add other indicator filters to improve signal quality and reduce false signals.
-
Add position sizing and risk management modules.
-
Test parameters across different products to find optimized fits.
-
Add machine learning modules for adaptive parameter tuning.
Summary
The strategy combines trend reversal and cyclical turning point detection for more reliable market entry. The biggest advantage is high signal quality and flexibility. The main risk is missing early trends, which can be mitigated via parameter tuning and stop loss. Future improvements can focus on stop loss, parameter optimization, signal filtering etc. to make the strategy robust across market environments.
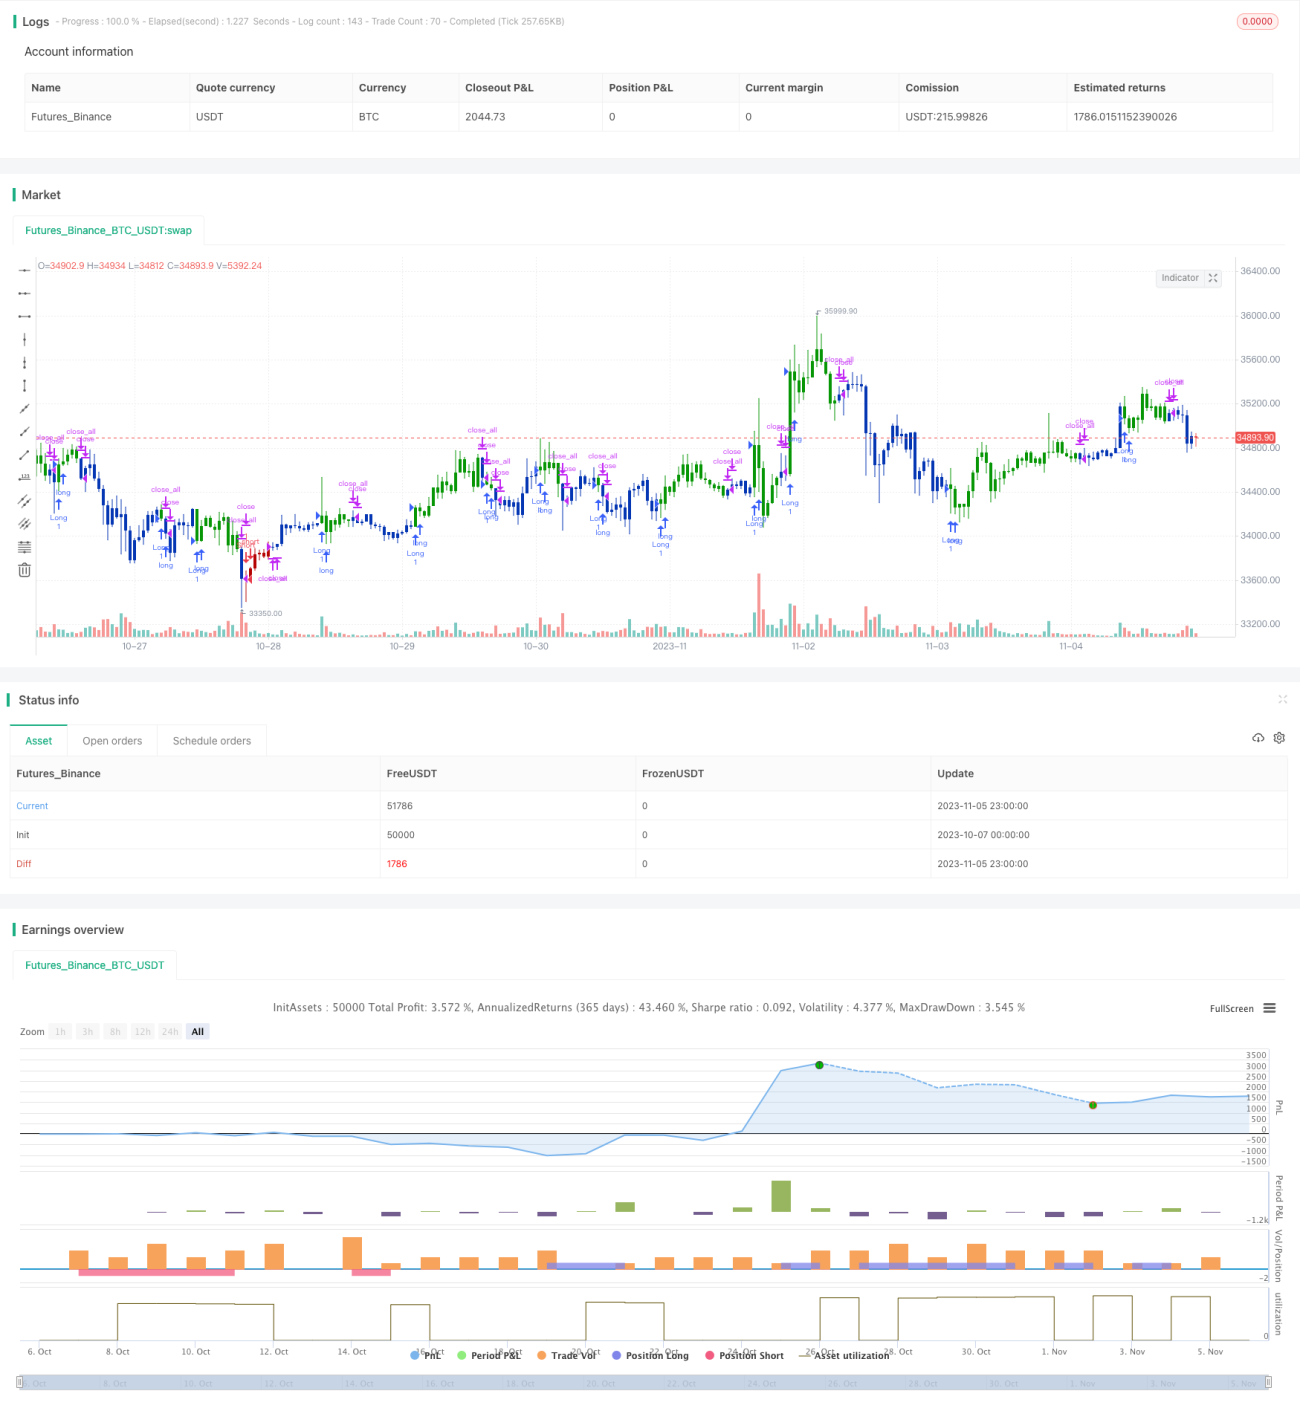
/*backtest
start: 2023-10-07 00:00:00
end: 2023-11-06 00:00:00
period: 1h
basePeriod: 15m
exchanges: [{"eid":"Futures_Binance","currency":"BTC_USDT"}]
*/

//@version=4
////////////////////////////////////////////////////////////
//  Copyright by HPotter v1.0 26/11/2019
// This is combo strategies for get a cumulative signal. - 1