Multi Indicator Scoring Trading Strategy

Author: ChaoZhang, Date: 2023-11-07 16:16:45
Tags:

img

Overview

The multi indicator scoring trading strategy integrates technical indicators scoring to identify trend direction and strength for automated trading. It considers a group of indicators including Ichimoku Cloud, HMA, RSI, Stoch, CCI and MACD. Each indicator result is scored and the overall score is calculated by averaging all indicators’ scores. When the overall score is above threshold, go long. When below threshold, go short.

Strategy Logic

The strategy consists of several parts:

  1. Calculate a group of indicators including Ichimoku Cloud, Hull Moving Average, Relative Strength Index, Stochastic, Commodity Channel Index and Moving Average Convergence Divergence.

  2. Score each indicator. Give positive score for bullish signal and negative score for bearish signal.

  3. Sum and average all indicators’ scores to get an overall score.

  4. Compare overall score with preset threshold to determine overall trend direction. Go long when score is higher than threshold, short when lower.

  5. Open position based on judgment. Long when bullish, short when bearish.

  6. Set stop loss and take profit based on ATR.

The strategy makes full use of advantages of multiple indicators to determine market trend. Compared with single indicator, it helps filter out some false signals and increase reliability.

Advantage Analysis

The advantages of this strategy include:

  1. Multiple indicators combined improve signal accuracy. Single indicator is prone to false signals. Scoring and averaging helps filter out false signals effectively.

  2. Utilize indicators’ strengths to identify trend and momentum. For example, Ichimoku Cloud for trend, Stochastics for overbought and oversold.

  3. Automated trading avoids emotional impacts and strictly follows strategy signals.

  4. Use ATR for stop loss and take profit helps risk management.

  5. Parameters and score threshold can be optimized for different products.

  6. Simple and clear logic, easy to understand and modify.

Risk Analysis

The risks of this strategy:

  1. Multiple indicators combined is not necessarily better than single one. Need repetitive tests to find optimal parameters.

  2. Averaging scores cannot completely avoid losses when indicators give wrong signals.

  3. ATR stops may be too close or too loose. Need adjustments based on product character.

  4. Avoid overfitting from excessive optimizations. Test robustness on different products and time periods.

  5. High trading frequency increases transaction costs which also affect end return.

Optimization Directions

The strategy can be optimized in the following aspects:

  1. Test more indicator combinations to find optimal selection for specific product.

  2. Adjust indicator score weights, optimize scoring algorithm.

  3. Dynamic ATR parameters to better fit market volatility.

  4. Add trade filters to reduce unnecessary trading frequency, such as trend filter or volume filter.

  5. Stepwise optimize to find parameter range, then random/grid optimize for best parameter set.

  6. Test robustness on multiple products and timeframes to avoid overfitting.

  7. Combine with other effective trading strategies for portfolio.

Conclusion

The multi indicator scoring strategy improves signal accuracy and reliability through averaging indicator scores. With large optimization space, it can be optimized for good results on different products. Overfitting risks need attention to keep parameter optimization and strategy testing scientific. As a strategy idea with broad optimization directions, it deserves further research and application.
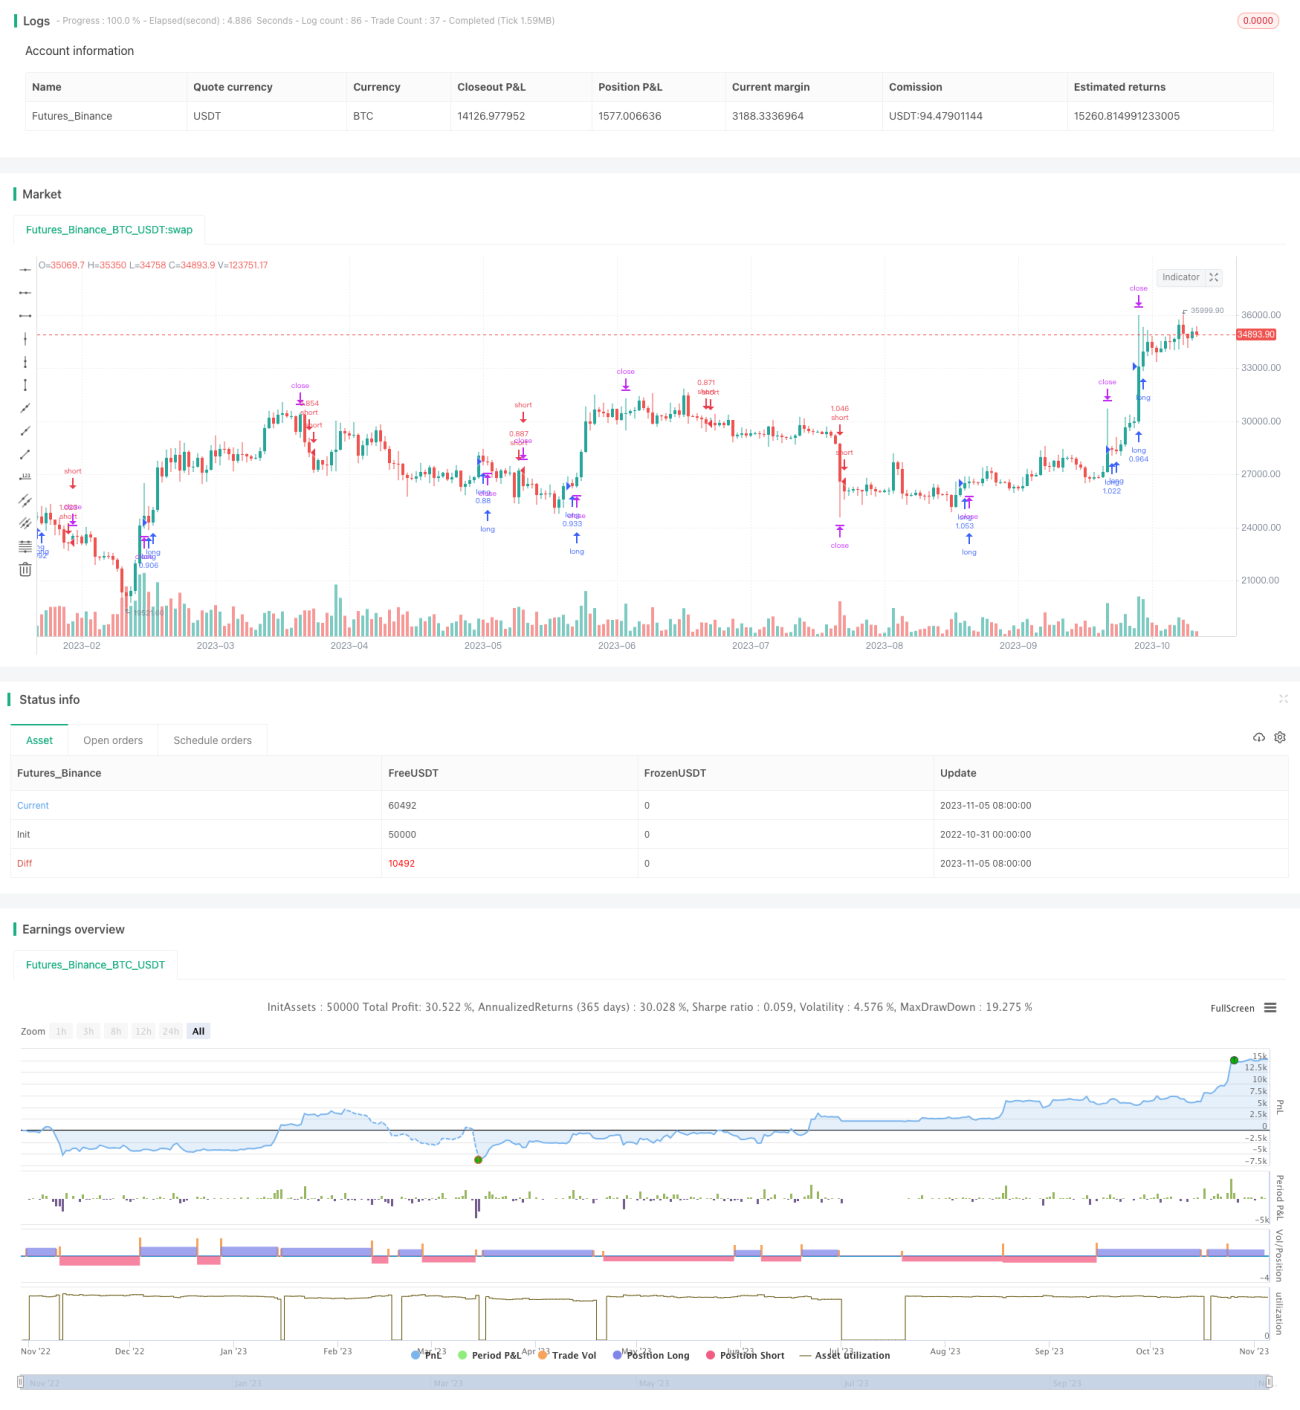

/*backtest
start: 2022-10-31 00:00:00
end: 2023-11-06 00:00:00
period: 1d
basePeriod: 1h
exchanges: [{"eid":"Futures_Binance","currency":"BTC_USDT"}]
*/

//@version=4
strategy(title="Ichi HMA RSI Stoch CCI MACD Technicals Rating Strategy",shorttitle="TRSv420",overlay=true,default_qty_type=strategy.percent_of_equity,default_qty_value=50,commission_type=strategy.commission.percent,commission_value=0.05)
res = input("", title="Indicator Timeframe", type=input.resolution)
Period = input(defval = 14, title = "Period Length", minval = 2)
MinSignalStrength= input(title="Minimum Signal Strength", type=input.float, defval=1.1, minval=0.00, maxval=2.00, step=0.1)
Price = input(defval=open, title="Price Source", type=input.source)
Use_Only_Buy= input(false, title = "Use ONLY BUY mode",type=input.bool)
Use_Only_Sell= input(false, title = "Use ONLY SELL mode",type=input.bool)
Use_ATR_SL_TP= input(true, title = "Use ATR for TP & SL",type=input.bool)
Use_Ichimoku= input(true, title = "Use Ichimoku",type=input.bool)
Use_HMA= input(true, title = "Use Hull MA",type=input.bool)
Use_RSI= input(true, title = "Use RSI",type=input.bool)
Use_Stoch= input(true, title = "Use Stoch",type=input.bool)
Use_CCI= input(true, title = "Use CCI",type=input.bool)
Use_MACD= input(true, title = "Use MacD",type=input.bool)
// Ichimoku Cloud
donchian(len) => avg(lowest(len), highest(len))
ichimoku_cloud() =>
    conversionLine = donchian(9)
    baseLine = donchian(26)
    leadLine1 = avg(conversionLine, baseLine)
    leadLine2 = donchian(52)
    [conversionLine, baseLine, leadLine1, leadLine2]
[IC_CLine, IC_BLine, IC_Lead1, IC_Lead2] = ichimoku_cloud()    
calcRatingMA(ma, src) => na(ma) or na(src) ? na : (ma == src ? 0 : ( ma < src ? 1 : -1 ))
calcRating(buy, sell) => buy ? 1 : ( sell ? -1 : 0 )
calcRatingAll() =>
    //============== HMA =================
    HMA10 = hma(Price, Period)
    HMA20 = hma(Price, 20)
    HMA30 = hma(Price, 30)
    HMA50 = hma(Price, 50)
    HMA100 = hma(Price, 100)
    HMA200 = hma(Price, 200)
    // Relative Strength Index, RSI
    RSI = rsi(Price,14)
    // Stochastic
    lengthStoch = 14
    smoothKStoch = 3
    smoothDStoch = 3
    kStoch = sma(stoch(Price, high, low, lengthStoch), smoothKStoch)
    dStoch = sma(kStoch, smoothDStoch)
    // Commodity Channel Index, CCI
    CCI = cci(Price, 20)
    // Moving Average Convergence/Divergence, MACD
    [macdMACD, signalMACD, _] = macd(Price, 12, 26, 9)
    // -------------------------------------------
    PriceAvg = hma(Price, Period)
    DownTrend = Price < PriceAvg
    UpTrend = Price > PriceAvg
    float ratingMA = 0
    float ratingMAC = 0
    if(Use_HMA)
        if not na(HMA10)
            ratingMA := ratingMA + calcRatingMA(HMA10, Price)
            ratingMAC := ratingMAC + 1
        if not na(HMA20)
            ratingMA := ratingMA + calcRatingMA(HMA20, Price)
            ratingMAC := ratingMAC + 1
        if not na(HMA30)
            ratingMA := ratingMA + calcRatingMA(HMA30, Price)
            ratingMAC := ratingMAC + 1
        if not na(HMA50)
            ratingMA := ratingMA + calcRatingMA(HMA50, Price)
            ratingMAC := ratingMAC + 1
        if not na(HMA100)
            ratingMA := ratingMA + calcRatingMA(HMA100, Price)
            ratingMAC := ratingMAC + 1
        if not na(HMA200)
            ratingMA := ratingMA + calcRatingMA(HMA200, Price)
            ratingMAC := ratingMAC + 1
    if(Use_Ichimoku)
        float ratingIC = na
        if not (na(IC_Lead1) or na(IC_Lead2) or na(Price) or na(Price[1]) or na(IC_BLine) or na(IC_CLine))
            ratingIC := calcRating(
             IC_Lead1 > IC_Lead2 and Price > IC_Lead1 and Price < IC_BLine and Price[1] < IC_CLine and Price > IC_CLine,
             IC_Lead2 > IC_Lead1 and Price < IC_Lead2 and Price > IC_BLine and Price[1] > IC_CLine and Price < IC_CLine)
        if not na(ratingIC)
            ratingMA := ratingMA + ratingIC
            ratingMAC := ratingMAC + 1
    ratingMA := ratingMAC > 0 ? ratingMA / ratingMAC : na
    float ratingOther = 0
    float ratingOtherC = 0
    if(Use_RSI)
        ratingRSI = RSI
        if not(na(ratingRSI) or na(ratingRSI[1]))
            ratingOtherC := ratingOtherC + 1
            ratingOther := ratingOther + calcRating(ratingRSI < 30 and ratingRSI[1] < ratingRSI, ratingRSI > 70 and ratingRSI[1] > ratingRSI)
    if(Use_Stoch)
        if not(na(kStoch) or na(dStoch) or na(kStoch[1]) or na(dStoch[1]))
            ratingOtherC := ratingOtherC + 1
            ratingOther := ratingOther + calcRating(kStoch < 20 and dStoch < 20 and kStoch > dStoch and kStoch[1] < dStoch[1], kStoch > 80 and dStoch > 80 and kStoch < dStoch and kStoch[1] > dStoch[1])
    if(Use_CCI)
        ratingCCI = CCI
        if not(na(ratingCCI) or na(ratingCCI[1]))
            ratingOtherC := ratingOtherC + 1
            ratingOther := ratingOther + calcRating(ratingCCI < -100 and ratingCCI > ratingCCI[1], ratingCCI > 100 and ratingCCI < ratingCCI[1])
    if(Use_MACD)
        if not(na(macdMACD) or na(signalMACD))
            ratingOtherC := ratingOtherC + 1
            ratingOther := ratingOther + calcRating(macdMACD > signalMACD, macdMACD < signalMACD)
    ratingOther := ratingOtherC > 0 ? ratingOther / ratingOtherC : na
    float ratingTotal = 0
    float ratingTotalC = 0
    if not na(ratingMA)
        ratingTotal := ratingTotal + ratingMA
        ratingTotalC := ratingTotalC + 1
        ratingTotal := ratingTotal + ratingOther
        ratingTotalC := ratingTotalC + 1
    ratingTotal := ratingTotalC > 0 ? ratingTotal / ratingTotalC : na
    [ratingTotal, ratingOther, ratingMA, ratingOtherC, ratingMAC]
[ratingTotal, ratingOther, ratingMA, ratingOtherC, ratingMAC]  = security(syminfo.tickerid, res, calcRatingAll(), lookahead=false)
tradeSignal = ratingTotal+ratingOther+ratingMA
dynSLpoints(factor) => factor * atr(14) / syminfo.mintick
if not (Use_Only_Sell)
    strategy.entry("long", strategy.long, when = tradeSignal > MinSignalStrength)
if not (Use_Only_Buy)    
    strategy.entry("short", strategy.short, when = tradeSignal < -MinSignalStrength)
if(Use_ATR_SL_TP)
    strategy.exit("sl/tp", loss = dynSLpoints(3), trail_points = dynSLpoints(5), trail_offset = dynSLpoints(2))

More