Chaotic Trading Rules Stop Loss Strategy

Overview
The core idea of this strategy is to add some key trading management rules on the basis of RSI strategy, including stop loss, take profit, trailing stop loss, and leverage tracking stop loss. This allows the strategy to achieve higher returns during trending markets and minimize losses during ranging markets in backtest.
Strategy Logic
The strategy first calculates the RSI indicator. It goes long when RSI is below the oversold level and goes short when RSI is above the overbought level.
After a long signal is triggered, the highest price at that time is recorded as the trailing stop loss reference point. If the price falls below the stop loss point minus the stop loss range, the position is closed by stop loss.
After a short signal is triggered, the lowest price at that time is recorded as the trailing stop loss reference point. If the price rises above the stop loss point plus the stop loss range, the position is closed by stop loss.
At the same time, fixed take profit and stop loss distances are set. If the price reaches the take profit distance, take profit to close position. If it reaches the stop loss distance, close position by stop loss.
In addition, a leverage tracking stop loss line is set based on the leverage. If the price hits the leverage tracking stop loss line, the position is closed by stop loss.
By trailing the highest price during uptrends and the lowest price during downtrends, combined with fixed take profit and stop loss distances, higher returns can be achieved in trending markets. Meanwhile, leverage tracking stop loss helps avoid expanding losses.
Advantage Analysis
The biggest advantage of this strategy is the introduction of multiple trading management rules that better control risks while leveraging the strengths of RSI strategy.
Specifically, the advantages are:
-
Trailing stop loss can continuously follow the trend to gain higher profit during trending markets.
-
Fixed take profit and stop loss lock in some profits and avoid full profits being wiped out when trend reverses.
-
Leverage tracking stop loss helps avoid expanding losses and controls risk.
-
The combination of various stop loss methods can exert their strengths in different market environments, improving overall stability of the strategy.
-
Flexible adjustment of strategy parameters fits different trading instruments and market environments.
-
Easy to understand logic facilitates verification, optimization and application.
Risk Analysis
The main risks of this strategy come from:
-
RSI strategy itself has some whipsaw risks, which may trigger stop loss. RSI parameters can be optimized.
-
Oscillation around stop loss points may frequently trigger stop loss. Stop loss range can be widened.
-
Take profit distance cannot fully lock in profits during trending markets. Other indicators can help determine trend ending.
-
Fixed stop loss distance may be too small to fully avoid losses. Consider using oscillating stop loss or dynamic stop loss.
-
Excessive leverage leads to stop loss being too close to entry price. Lower leverage setting should be used.
-
Backtest period may not fully represent future market conditions. Proper risk control should be implemented and different periods tested.
The above risks can be mitigated through parameter tuning, optimizing stop loss mechanisms, risk control etc. But no strategy can completely avoid market risks. Proper risk control is a must.
Optimization Directions
The strategy can be further optimized in the following aspects:
-
Optimize RSI parameters to reduce whipsaw trades, and test optimum parameters for different markets.
-
Try other indicators like KD, MACD combined with RSI to filter entries.
-
Use machine learning to dynamically optimize stop loss and take profit parameters.
-
Test more complex stop loss mechanisms like oscillating stop loss, average stop loss, dynamic stop loss etc.
-
Optimize leverage setting and study impacts on profit and risk control.
-
Auto adjust parameters based on market regime changes, like α-Dual Thrust.
-
Incorporate other factors to determine trend persistence, e.g. volume energy.
-
Use deep learning models to develop more robust and interpretable stop loss ways.
-
Test data from different instruments and time periods to evaluate strategy robustness.
Conclusion
This strategy complements RSI strategy with various stop loss methods, giving full play to the dual effects of stop loss in profiting from trends and controlling risks. There is still large room for optimization. The ideas can be extended to more strategies and trading instruments. Stop loss strategies are worth in-depth research and can become a very important part of mechanical trading systems after continuous optimization and verification.
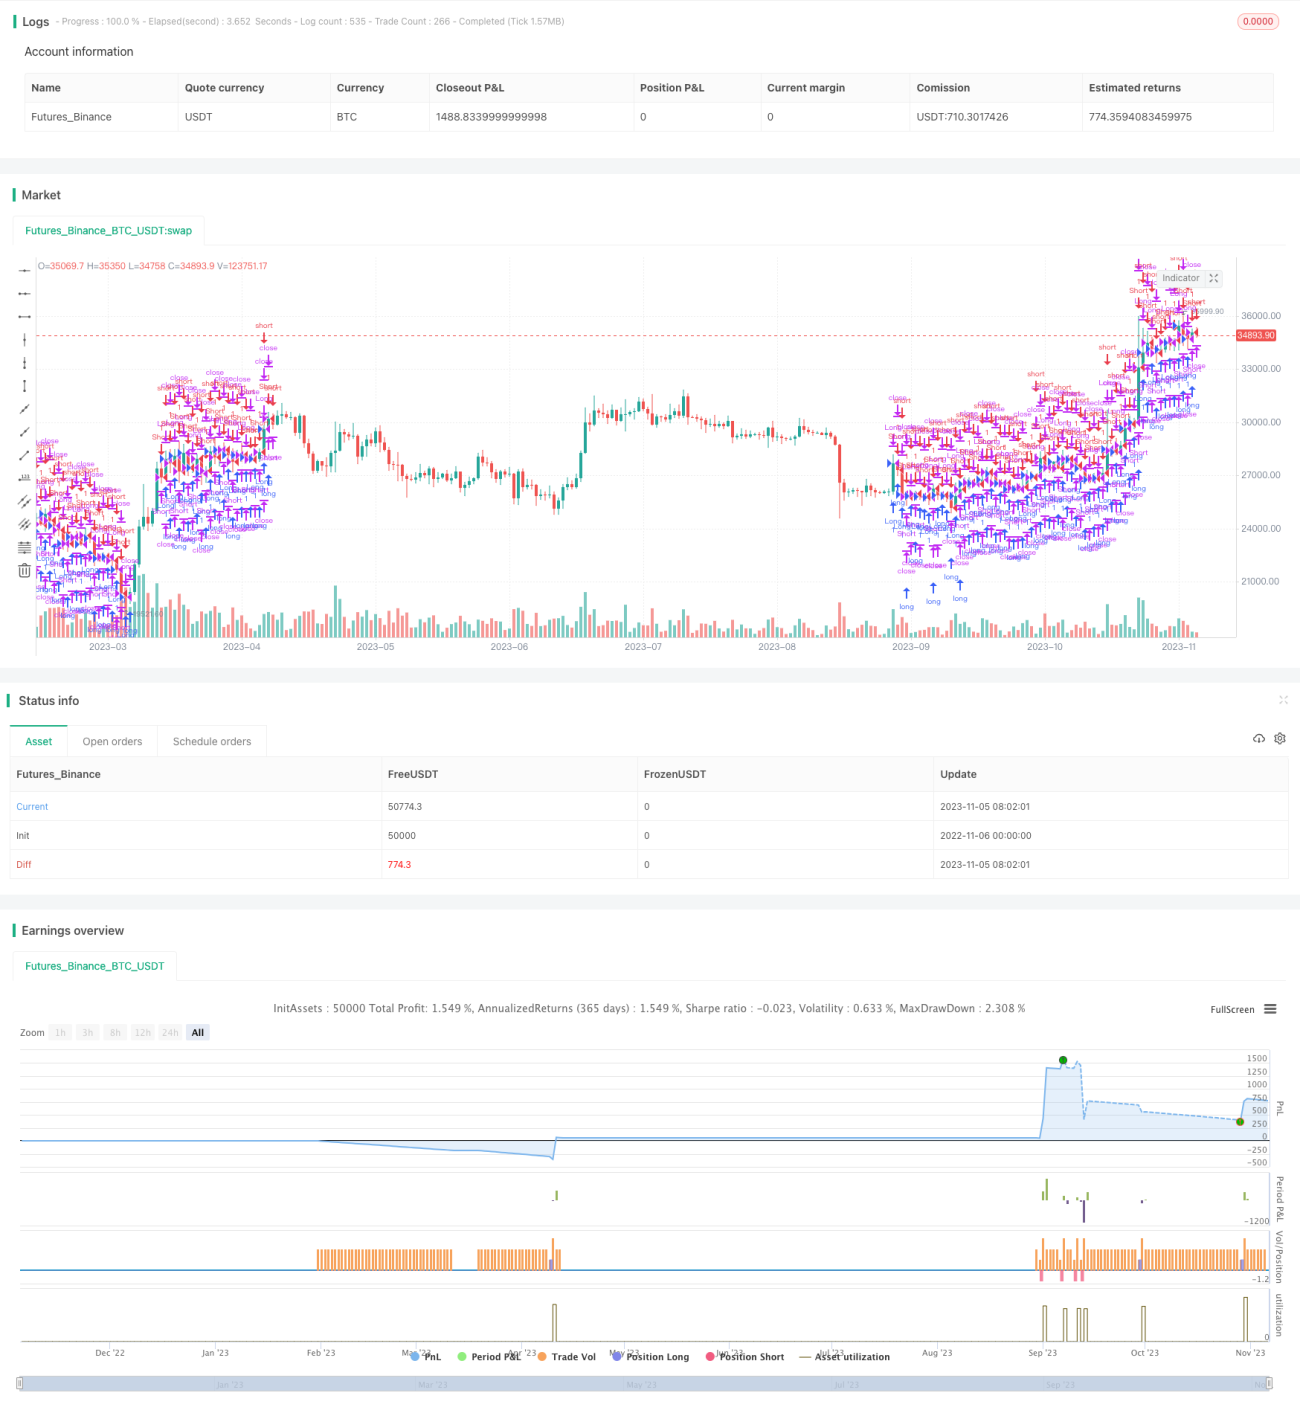
/*backtest
start: 2022-11-06 00:00:00
end: 2023-11-06 00:00:00
period: 1d
basePeriod: 1h
exchanges: [{"eid":"Futures_Binance","currency":"BTC_USDT"}]
*/

//@version=2
strategy("Adding some essential components to a prebuilt RSI strategy", overlay=true)

/////////////// Component Code Start ///////////////- 1