Momentum Trend Tracking Strategy

Author: ChaoZhang, Date: 2023-11-07 16:49:49
Tags:

img

Overview

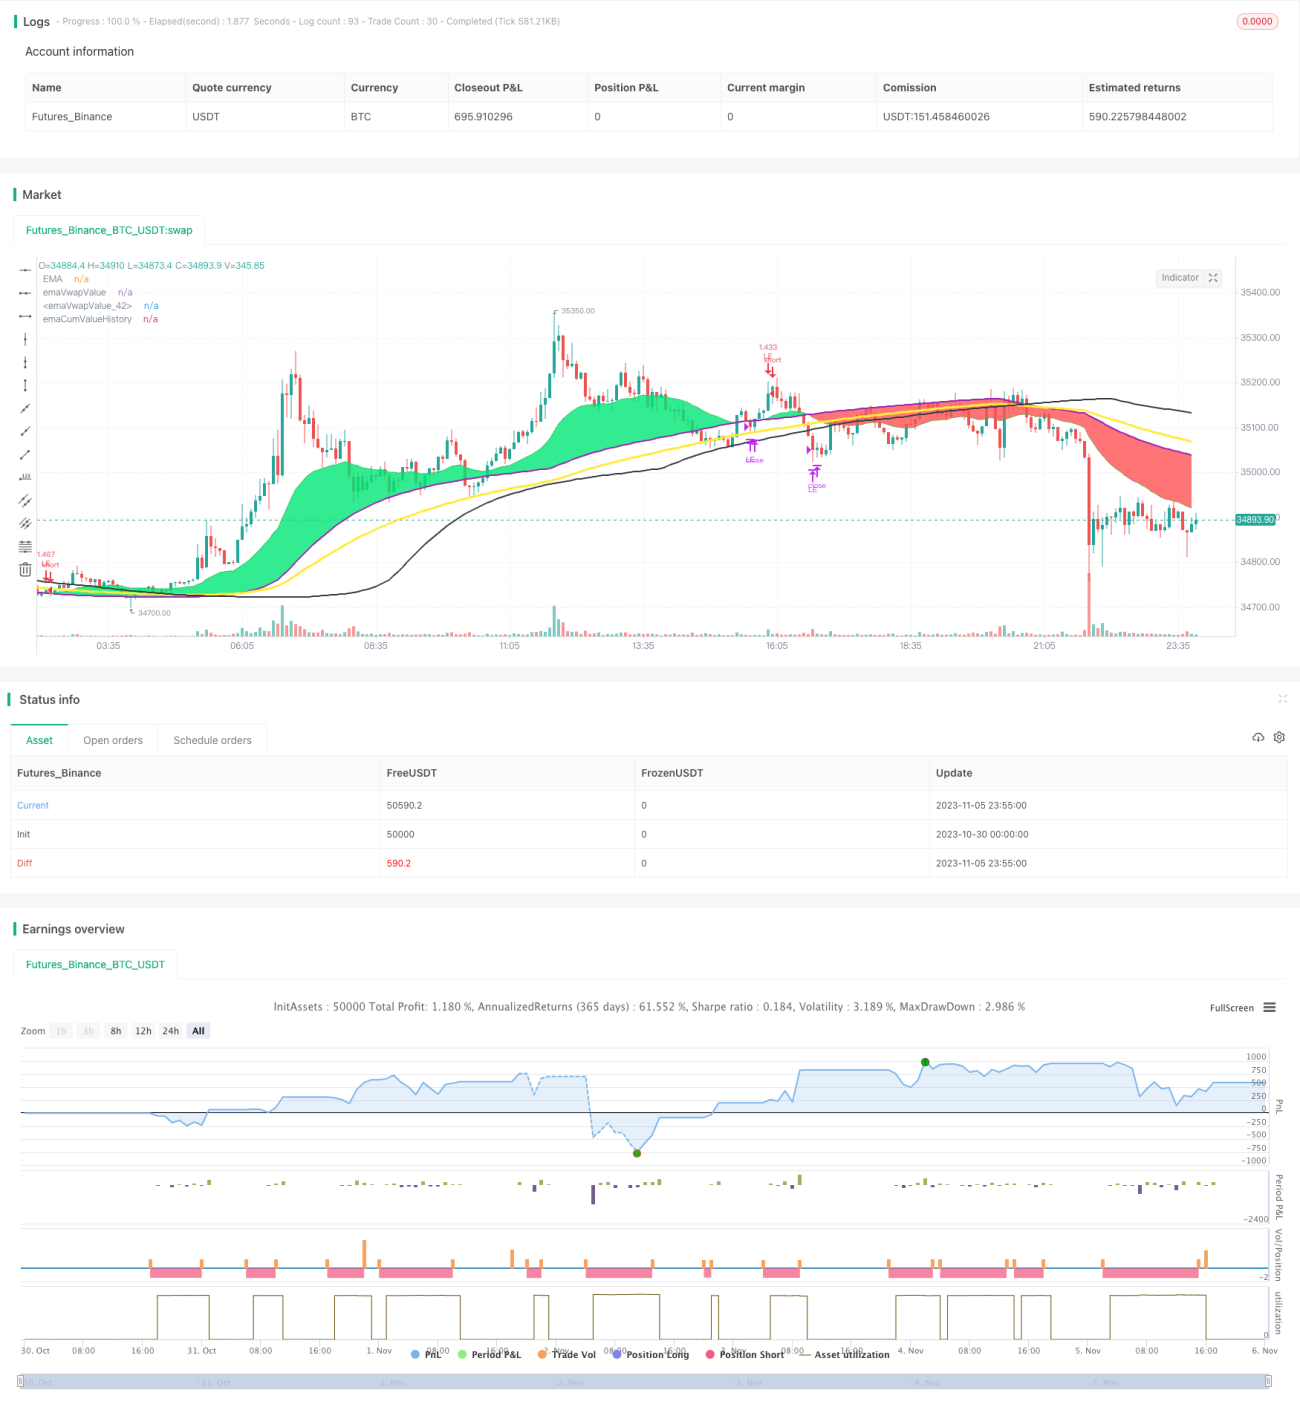
This strategy is based on trend analysis of moving averages and volume, sets momentum indicators, and makes buy and sell operations by tracking trends.

Strategy Principles

  1. Calculate the EMA of close price and the cumulative EMA of volume
  2. When close crosses above EMA, it is judged as an upward trend and long position is taken
  3. When continues going up, close crosses above 2 times of cumulative EMA, add to long position
  4. Set RSI indicator, when RSI exceeds 90, close 1/3 position for profit taking
  5. When close crosses below EMA, it is judged as downward trend, close all long positions
  6. When close crosses below EMA, it is judged as downward trend, take short position
  7. Set stop loss line at fixed percentage of entry price
  8. Profit taking of short position is the same as long position

Advantage Analysis

The main advantages of this strategy are:

  1. Using EMA to judge trends can effectively track trends
  2. Using cumulative EMA of volume to judge true trend changes
  3. Tracking momentum indicator RSI for profit taking
  4. Good risk control with stop loss
  5. Can adapt to different market conditions, parameters can be adjusted flexibly

Risk Analysis

The main risks of this strategy are:

  1. EMA has lagging, may miss turning points
  2. Volume may not always reflect real trend
  3. Fixed percentage stop loss may be too mechanistic
  4. Too many parameters make parameter tuning difficult
  5. High trading frequency leads to high trading costs

Risk Solutions:

  1. Optimize EMA parameters to reduce lagging
  2. Combine with other indicators to confirm volume signals
  3. Optimize stop loss points based on market conditions
  4. Simplify parameters, keep main settings only
  5. Relax stop loss and trading frequency appropriately

Optimization Directions

This strategy can be optimized in the following aspects:

  1. Test different EMA parameter settings to find optimal combination
  2. Add volume multiples as signal strength judgment for entry
  3. Combine with MACD, KD and other indicators to confirm entry
  4. Optimize stop loss percentage according to characteristics of specific stocks
  5. Optimize trading frequency to reduce trading costs

Summary

In summary, this is a trend tracking strategy based on moving average system. The core idea is to use EMA to determine trend direction, and confirm entry with VOLUME momentum indicator. It can be continuously optimized through parameter tuning, and assisted by other indicators for further confirmation. Overall it is a flexible trend tracking strategy, which can yield good returns after proficient use.


/*backtest
start: 2023-10-30 00:00:00
end: 2023-11-06 00:00:00
period: 5m
basePeriod: 1m
exchanges: [{"eid":"Futures_Binance","currency":"BTC_USDT"}]
*/

// This source code is subject to the terms of the Mozilla Public License 2.0 at https://mozilla.org/MPL/2.0/
// © mohanee

//@version=4
strategy("EMA_cumulativeVolume_crossover[Strategy]", overlay=true, pyramiding=5, default_qty_type=strategy.percent_of_equity,  default_qty_value=20, initial_capital=10000)


emaLength= input(25, title="EMA Length", minval=1, maxval=200)
cumulativePeriod = input(100,  title="cumulative volume Period", minval=1, maxval=200)


riskCapital = input(title="Risk % of capital", defval=10, minval=1)
stopLoss=input(8,title="Stop Loss",minval=1)
takePartialProfits=input(true, title="take partial profits  (percentage same as stop loss)")

tradeDirection=input(title="Trade Direction", defval="LONG", options=["LONG", "SHORT"])

avgPrice = (high + low + close) / 3
avgPriceVolume = avgPrice * volume

cumulPriceVolume = sum(avgPriceVolume, cumulativePeriod)
cumulVolume = sum(volume, cumulativePeriod)

cumValue = cumulPriceVolume / cumulVolume

emaVal=ema(close, emaLength)

emaCumValue1=ema(cumValue, emaLength)
emaCumValue2=ema(cumValue, emaLength*2)

emaCumValueHistory=ema(cumValue[emaLength], emaLength)


//vwapVal1=vwap(hlc3)

rsiVal=rsi(close,5)

plotEma=plot(emaVal, title="EMA", color=color.green,  transp=25)
//plot(vwapValue, title="Cumulate Volumne", color=color.orange,  linewidth=2, transp=25)
//plot(vwapVal1, title="vwapVal1", color=color.purple,  linewidth=1, transp=25)
plotCum=plot(emaCumValue1, title="emaVwapValue", color=color.purple,  linewidth=2, transp=35)
plot(emaCumValue2, title="emaVwapValue", color=color.yellow,  linewidth=3, transp=25)
fill(plotEma,plotCum, color=emaVal>emaCumValue1 ? color.lime : color.red, transp=35, title="ema and cum area")

plot(emaCumValueHistory, title="emaCumValueHistory", color=color.black,  linewidth=2, transp=25)


//bgcolor(emaVal>vwapValue?color.blue:color.purple)    

//Entry--
//Echeck how many units can be purchased based on risk manage ment and stop loss
qty1 = (strategy.equity  * riskCapital / 100 ) /  (close*stopLoss/100)  

//check if cash is sufficient  to buy qty1  , if capital not available use the available capital only
qty1:= (qty1 * close >= strategy.equity ) ? (strategy.equity / close) : qty1

//strategy.entry(id="LE",comment="LE", long=true, qty=qty1, when=crossover(emaVal, vwapValue)  and (tradeDirection=="LONG") )    //emaVal>vwapValue and crossover(close , emaVal)

strategy.entry(id="LE",comment="LE", long=true, qty=qty1, when=strategy.position_size==0 and crossover(emaVal, emaCumValue1)  and (tradeDirection=="LONG") )    //emaVal>vwapValue and crossover(close , emaVal)

//re-entry
rentryCondition1=strategy.position_size>1 and emaVal > emaCumValue1 and emaCumValue1>emaCumValue2 and crossover(close, emaCumValue2) and close>open and  (tradeDirection=="LONG")
strategy.entry(id="LE",comment="LE RE", long=true, qty=qty1, when=rentryCondition1 )

rentryCondition2=strategy.position_size>1 and emaVal > emaCumValue1 and emaCumValue1>emaCumValueHistory and crossover(close, emaCumValueHistory) and close>open and  (tradeDirection=="LONG")
//strategy.entry(id="LE",comment="LE RE", long=true, qty=qty1, when=rentryCondition2 )    


//stoploss
stopLossVal=  strategy.position_size>=1 ?  (strategy.position_avg_price * (1-(stopLoss*0.01) )) : 0.00

//draw initil stop loss
//plot(strategy.position_size>=1 ? stopLossVal : na, color = color.purple , style=plot.style_linebr,  linewidth = 2, title = "stop loss")

//partial exits
takeProfit=  strategy.position_size>=1 ?  (strategy.position_avg_price * (1+(1*0.01) )) : ( close[1] * 2 )
//if(takePartialProfits==true)
    //strategy.close(id="LE", comment="Partial"+tostring(close-strategy.position_avg_price, "###.##") , qty=strategy.position_size/3 , when = (tradeDirection=="LONG" ) and close>takeProfit and crossunder(close, emaVal) )    //close<close[1] and close[1]<close[2] and close[2]<close[3])

strategy.close(id="LE", comment="PExit Points=>"+tostring(close-strategy.position_avg_price, "###.##") , qty=strategy.position_size/3 , when = (tradeDirection=="LONG" ) and  takePartialProfits == true and close>=takeProfit and crossunder(rsiVal,90) )

profitVal=    strategy.position_size>=1 ?  (strategy.position_avg_price * (1+(1*0.01) )) : ( close[1] * 2 )

//strategy.close(id="LE" , comment="LE Exit Points="+tostring(close-strategy.position_avg_price, "###.##"), when=crossunder(emaVal, vwapValue) and (tradeDirection=="LONG") )

strategy.close(id="LE" , comment="Exit Points=>"+tostring(close-strategy.position_avg_price, "###.##"), when=  crossunder(emaVal, emaCumValue1) and (tradeDirection=="LONG") )


strategy.close(id="LE" , comment="SL Exit Loss="+tostring(close-strategy.position_avg_price, "###.##"), when= close < stopLossVal   and (tradeDirection=="LONG") )


//for short  you dont have to wait crossodown of ema, falling is speed , so just check if close crossing down vwapVal
strategy.entry(id="SE",comment="SE", long=false, qty=qty1, when=crossunder(emaVal, emaCumValue1) and (tradeDirection=="SHORT") )    //emaVal>vwapValue and crossover(close , emaVal)


//stoploss
stopLossValUpside=  abs(strategy.position_size)>=1 and tradeDirection=="SHORT" ?  (strategy.position_avg_price * (1+(stopLoss*0.01) )) : 0.00

//draw initil stop loss
//plot(abs(strategy.position_size)>=1 and tradeDirection=="SHORT" ? stopLossValUpside : na, color = color.purple , style=plot.style_linebr,  linewidth = 2, title = "stop loss")

//partial exits
shortTakeProfit=  abs(strategy.position_size)>=1 and tradeDirection=="SHORT" ?  (strategy.position_avg_price * (1-(stopLoss*0.01) )) : 0.00
if(takePartialProfits==true)
    strategy.close(id="SE", comment="Partial" , qty=strategy.position_size/3 , when = (tradeDirection=="SHORT"   ) and  crossover(rsiVal,15) )  //close<takeProfit and (emaVal - close)>8 )
  
//strategy.close(id="SE" , comment="SE Exit Points="+tostring(close-strategy.position_avg_price, "###.##"), when=crossover(emaVal, vwapValue) and (tradeDirection=="SHORT") )
//strategy.close(id="SE" , comment="SE Exit Points="+tostring(close-strategy.position_avg_price, "###.##"), when= abs(strategy.position_size)>=1 and ( (emaVal<emaCumValue1 and close>emaCumValue1 and open>emaCumValue1 and close>open )   or (crossover(emaVal,emaCumValue1))  ) and (tradeDirection=="SHORT") )

//strategy.close(id="SE" , comment="SL Exit Loss="+tostring(close-strategy.position_avg_price, "###.##"), when= abs(strategy.position_size)>=1 and  close > stopLossValUpside   and (tradeDirection=="SHORT"   ) )
strategy.close(id="SE" , comment="SL Exit Loss="+tostring(close-strategy.position_avg_price, "###.##"), when= abs(strategy.position_size)>=1 and  crossover(emaVal, emaCumValue1)   and (tradeDirection=="SHORT"   ) )


More