High Low Breakout for Quantitative Trading

Overview
The Fusion strategy combines a 123 reversal pattern strategy and a high low breakout strategy into a quantitative trading system. By synthesizing indicator signals across different timeframes, it aims to achieve multi-timeframe capital advantage and generate excess returns in the medium to long term.
Strategy Logic
The Fusion strategy consists of two components:
-
123 Reversal Strategy
This strategy originates from the idea on p183 of the book "How I Tripled My Money in the Futures Market" by Ulf Jensen. It generates trading signals by examining the relationship between the closing prices of the past two days and the previous day, together with the Stochastic indicator to gauge overbought and oversold market conditions. Specifically, a buy signal is generated when the closing prices of two consecutive days are higher than the previous day, and the Stochastic Slow indicator is below 50. A sell signal is generated when the closing prices of two consecutive days are lower than the previous day, and the Stochastic Fast indicator is above 50. By incorporating the Stochastic indicator, this strategy avoids buying at market tops and selling at bottoms. -
High Low Breakout Strategy
This strategy identifies trading signals by detecting price breakouts beyond previous high/low levels over different time periods. It calculates the highest high and lowest low over the current and previous periods and generates buy signals when price breaks above the high, and sell signals when price breaks below the low. The advantage of this strategy is its ability to identify trend pattern changes in higher timeframes, allowing earlier entry.
The Fusion strategy combines the signals from the above two strategies, and generates actual trading signals only when the signal directions align. This filters out some false signals caused by errors in a single strategy and improves signal reliability.
Advantages of the Strategy
-
Multi-timeframe synthesis improves signal accuracy
The integration of daily and higher timeframe patterns enhances accuracy of trading signal generation, avoiding distraction from short-term market noises. -
Fully utilizes the overbought/oversold judgement of Stochastic
The use of Stochastic Slow indicator prevents eager buying at overbought zones. The Stochastic Fast indicator prevents eager selling at oversold zones. Unnecessary losses are reduced. -
Timely catches trend patterns, lowering missing out opportunities
The high low breakout strategy identifies trend initiation in higher timeframes earlier, reducing missed trading opportunities. -
Flexible optimization with multiple sub-strategies
With multiple sub-strategies, huge optimization space allows parameter tuning of sub-strategies or introducing new ones to make the strategy more stable and reliable. -
Simple and clear logic
The straightforward structure and logic make the strategy easy to understand, modify and maintain in the future.
Risks of the Strategy
-
Multi-timeframe synthesis causes signal lag
Although accuracy is improved, combining signals across timeframes induces a lag and may miss short-term trading chances. -
123 patterns cannot identify longer timeframe trend reversals
The 123 reversal strategy only looks at recent days and misses key reversal points in longer timeframes. -
Wrong parameter settings may cause false signals
Bad parameter tuning of the Stochastic and breakout periods could result in excessive false signals. -
Purely technical, weak adaptivity to extreme events
Without considering fundamentals, the strategy adapts poorly to black swan events.
Corresponding solutions:
-
Shorten calculation periods properly to reduce lag.
-
Try introducing longer-term indicators or patterns as filters.
-
Optimize parameters and test robustness thoroughly in backtests.
-
Consider incorporating fundamental factors for signal filtering.
Directions for Optimization
-
Test and optimize parameters of sub-strategies for robustness.
-
Incorporate additional signals like fundamentals, money flow etc.
-
Introduce stop loss to limit max loss per trade.
-
Fine tune parameters for specific products to improve adaptiveness.
-
Assist with machine learning models.
Conclusion
In summary, the Fusion strategy combines the advantages of multi-timeframe technical indicators, aiming for more accurate and timely signal generation. Compared to single indicator strategies, it has superior trend sensing ability and more robust signal production. But it also suffers from lags and inadequate adaptivity to extreme events. Future improvements could come from more auxiliary tools, better parameter optimization and upgrading stability and profitability.
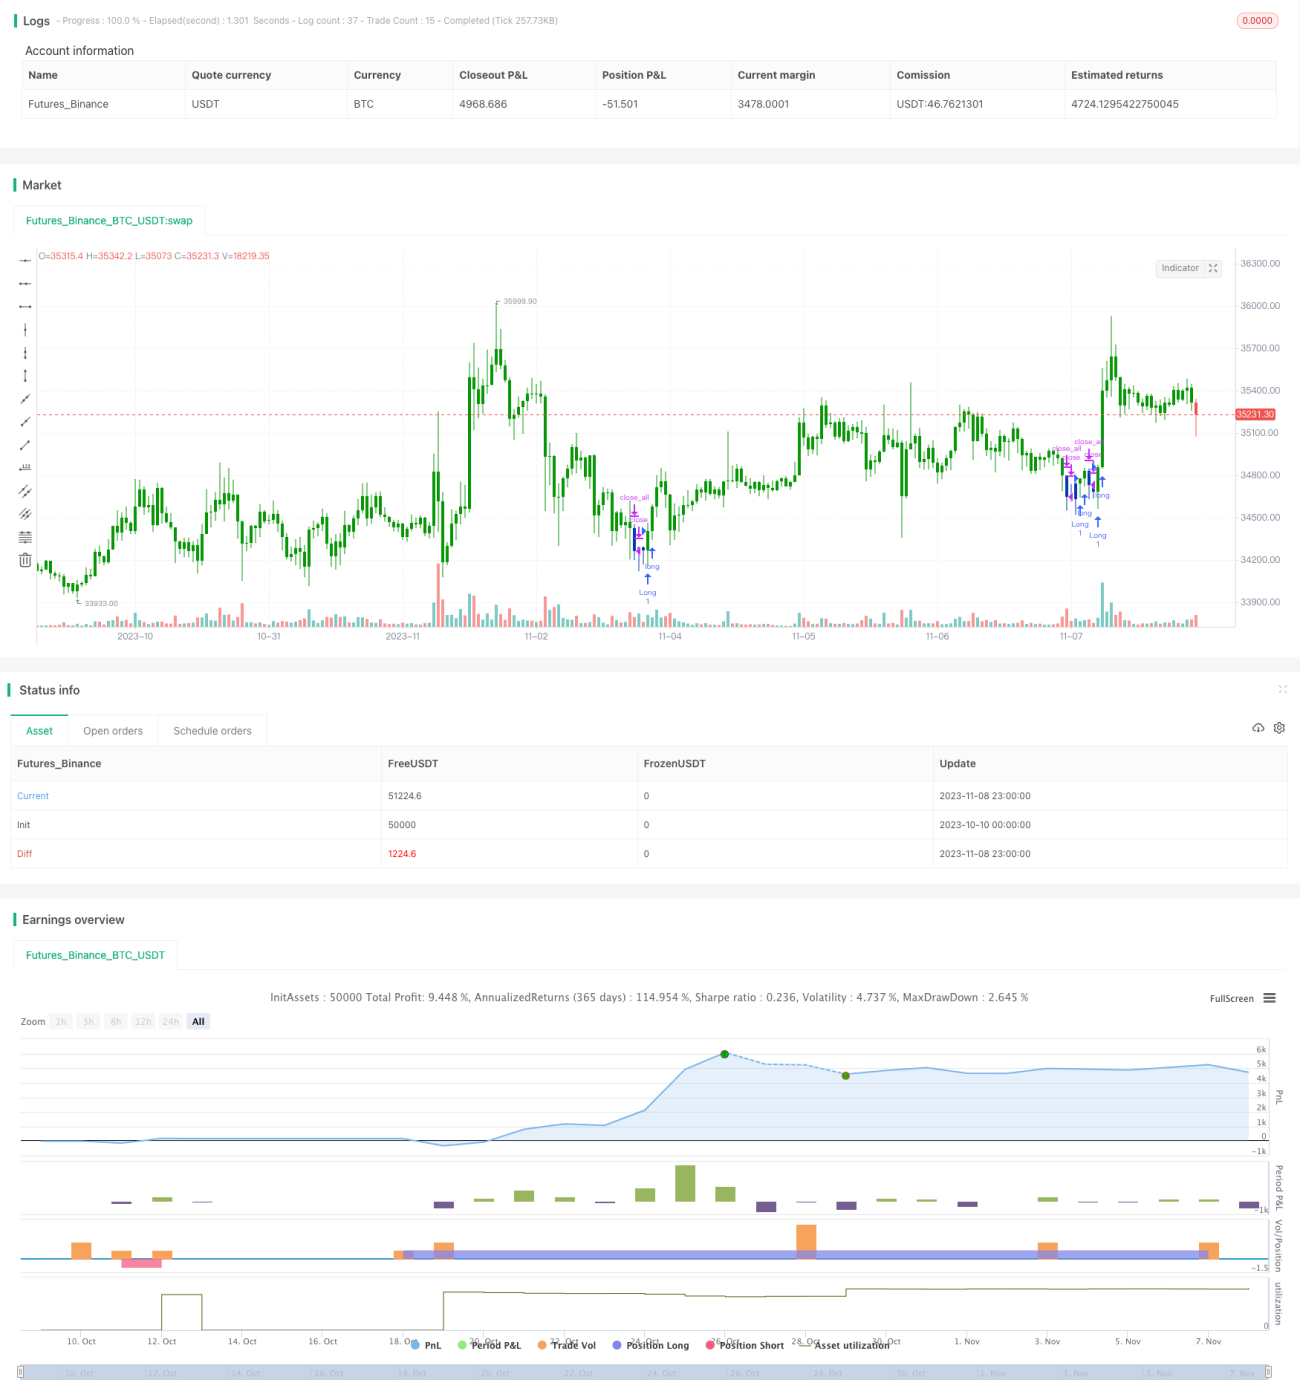
/*backtest
start: 2023-10-10 00:00:00
end: 2023-11-09 00:00:00
period: 1h
basePeriod: 15m
exchanges: [{"eid":"Futures_Binance","currency":"BTC_USDT"}]
*/

//@version=4
////////////////////////////////////////////////////////////
//  Copyright by HPotter v1.0 25/11/2020
// This is combo strategies for get a cumulative signal. - 1