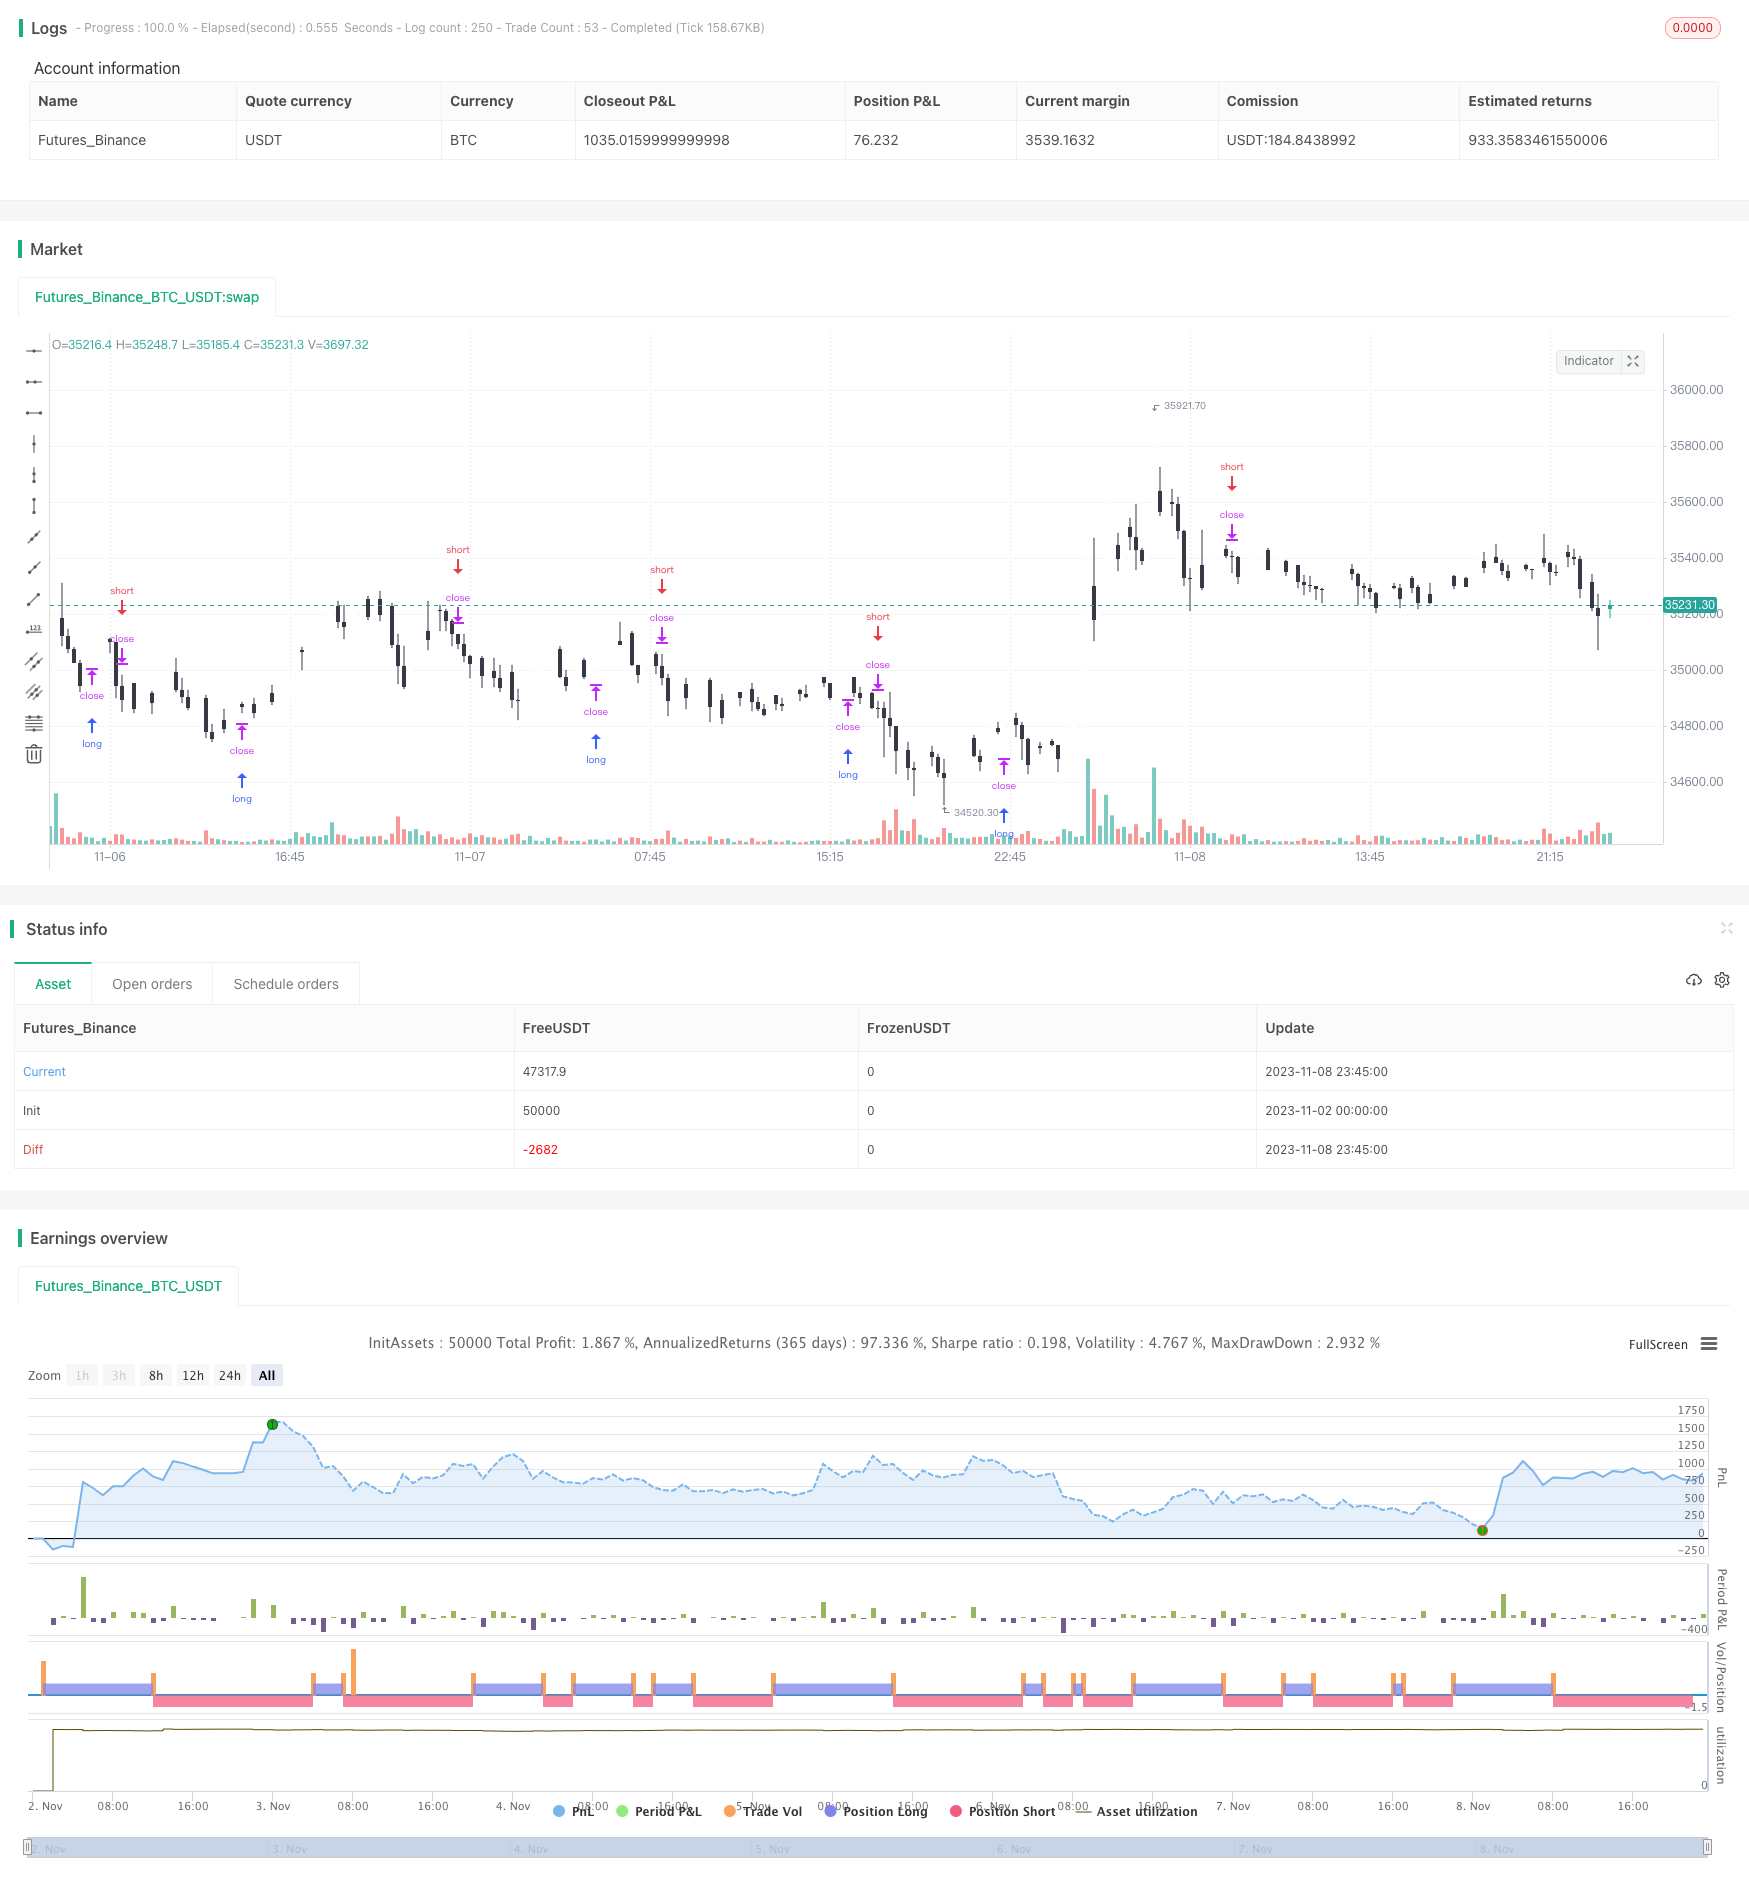
Momentum Tracking Strategy

Author: ChaoZhang, Date: 2023-11-10 12:12:44
Tags:

img

Overview

This strategy is based on momentum indicators combined with moving averages to track market trends. It goes long when there is strong upside momentum and goes short when there is strong downside momentum. It belongs to the category of trend following strategies.

Strategy Logic

  1. Calculate the momentum of price as: (Current Price - Price N periods ago) / Price N periods ago

  2. Calculate the moving average mid of price over N periods

  3. Normalize the momentum value to the range of 0-1

  4. When the normalized momentum is greater than 0.5 and price is above moving average, go long

  5. When the normalized momentum is less than 0.5 and price is below moving average, go short

  6. Use a moving stop loss mechanism with proper stop loss levels

The above covers the basic trading logic. When the market is trending, price will move persistently in one direction, generating large momentum values. The strategy judges the strength of the trend using the momentum and the direction using the moving average to decide on entry. Also, the stop loss is critical for controlling risks.

Advantage Analysis

This strategy has the following advantages:

  1. Tracks market trends, with potentially large gains

  2. Momentum is sensitive to price changes and responds quickly to trends

  3. Moving averages filter out random noise and combine well with momentum

  4. Stop loss mechanism limits loss on individual trades

  5. Simple and clear logic, easy to implement and backtest

  6. Flexible parameters can adapt to different periods and market regimes

Overall, this is a great strategy for trending markets. It can profit significantly from directional trends.

Risk Analysis

Despite the advantages, some risks need to be noted:

  1. Breakout risk in uptrends when price reverses after breaking out

  2. Reversal risk in downtrends when price bounces after breaking down

  3. Whipsaw signals when price oscillates around moving average

  4. Wrong signals if parameters are not properly set

  5. Underperforms in rangebound choppy markets

  6. Strict stop loss and movement required to prevent premature exit

To address these risks, stop loss strategy needs optimization, filter unnecessary signals with loose parameters, adjust parameters for different periods, and control position sizing.

Optimization Directions

Here are some ways the strategy can be further optimized:

  1. Test different parameter combinations for best backtest results

  2. Incorporate the Turtle Trading rules of exiting at 2N loss and 1N profit

  3. Optimize stop loss with volatility indicators for adaptive stop loss

  4. Add position sizing rules based on drawdown, time, etc

  5. Test different momentum calculation methods like exponential moving average momentum

  6. Add candlestick pattern filters for more robust signals

  7. Utilize machine learning for parameter optimization, feature selection, etc

  8. Incorporate some discretionary human input at key points

With these enhancements, the strategy may achieve better stability, adaptability, and profitability. But any optimization needs strict statistical validation to avoid overfitting.

Conclusion

The momentum tracking strategy is a simple and practical trend following approach. It can nimbly capture market trends and profit from riding bubbles and crashes. But curve fitting risks need to be managed with disciplined risk controls to maintain robustness. With parameter tuning and functionality extensions, the strategy can yield steady profits in more market regimes.


/*backtest
start: 2023-11-02 00:00:00
end: 2023-11-09 00:00:00
period: 15m
basePeriod: 5m
exchanges: [{"eid":"Futures_Binance","currency":"BTC_USDT"}]
*/

//@version=3
strategy("Momentum Strategy, rev.2", overlay=true)

//
// Data
//
src = input(close)
lookback = input(20)
cscheme=input(1, title="Bar color scheme", options=[1,2])

//
// Functions
//
momentum(ts, p) => (ts - ts[p]) / ts[p]

normalize(src, len) =>
    hi  = highest(src, len)
    lo  = lowest(src, len)
    res = (src - lo)/(hi - lo)

//
// Main
//
price = close
mid = sma(src, lookback)
mom = normalize(momentum(price, lookback),100)

//
// Bar Colors
//
clr1 = cscheme==1?black: red
clr2 = cscheme==1?white: green
barcolor(close < open ? clr1 : clr2)

//
// Strategy
//
if (mom > .5 and price > mid )
    strategy.entry("MomLE", strategy.long, stop=high+syminfo.mintick, comment="MomLE")
else
    strategy.cancel("MomLE")

if (mom < .5 and price < mid )
    strategy.entry("MomSE", strategy.short, stop=low-syminfo.mintick, comment="MomSE")
else
    strategy.cancel("MomSE")

//plot(strategy.equity, title="equity", color=red, linewidth=2, style=areabr)

More