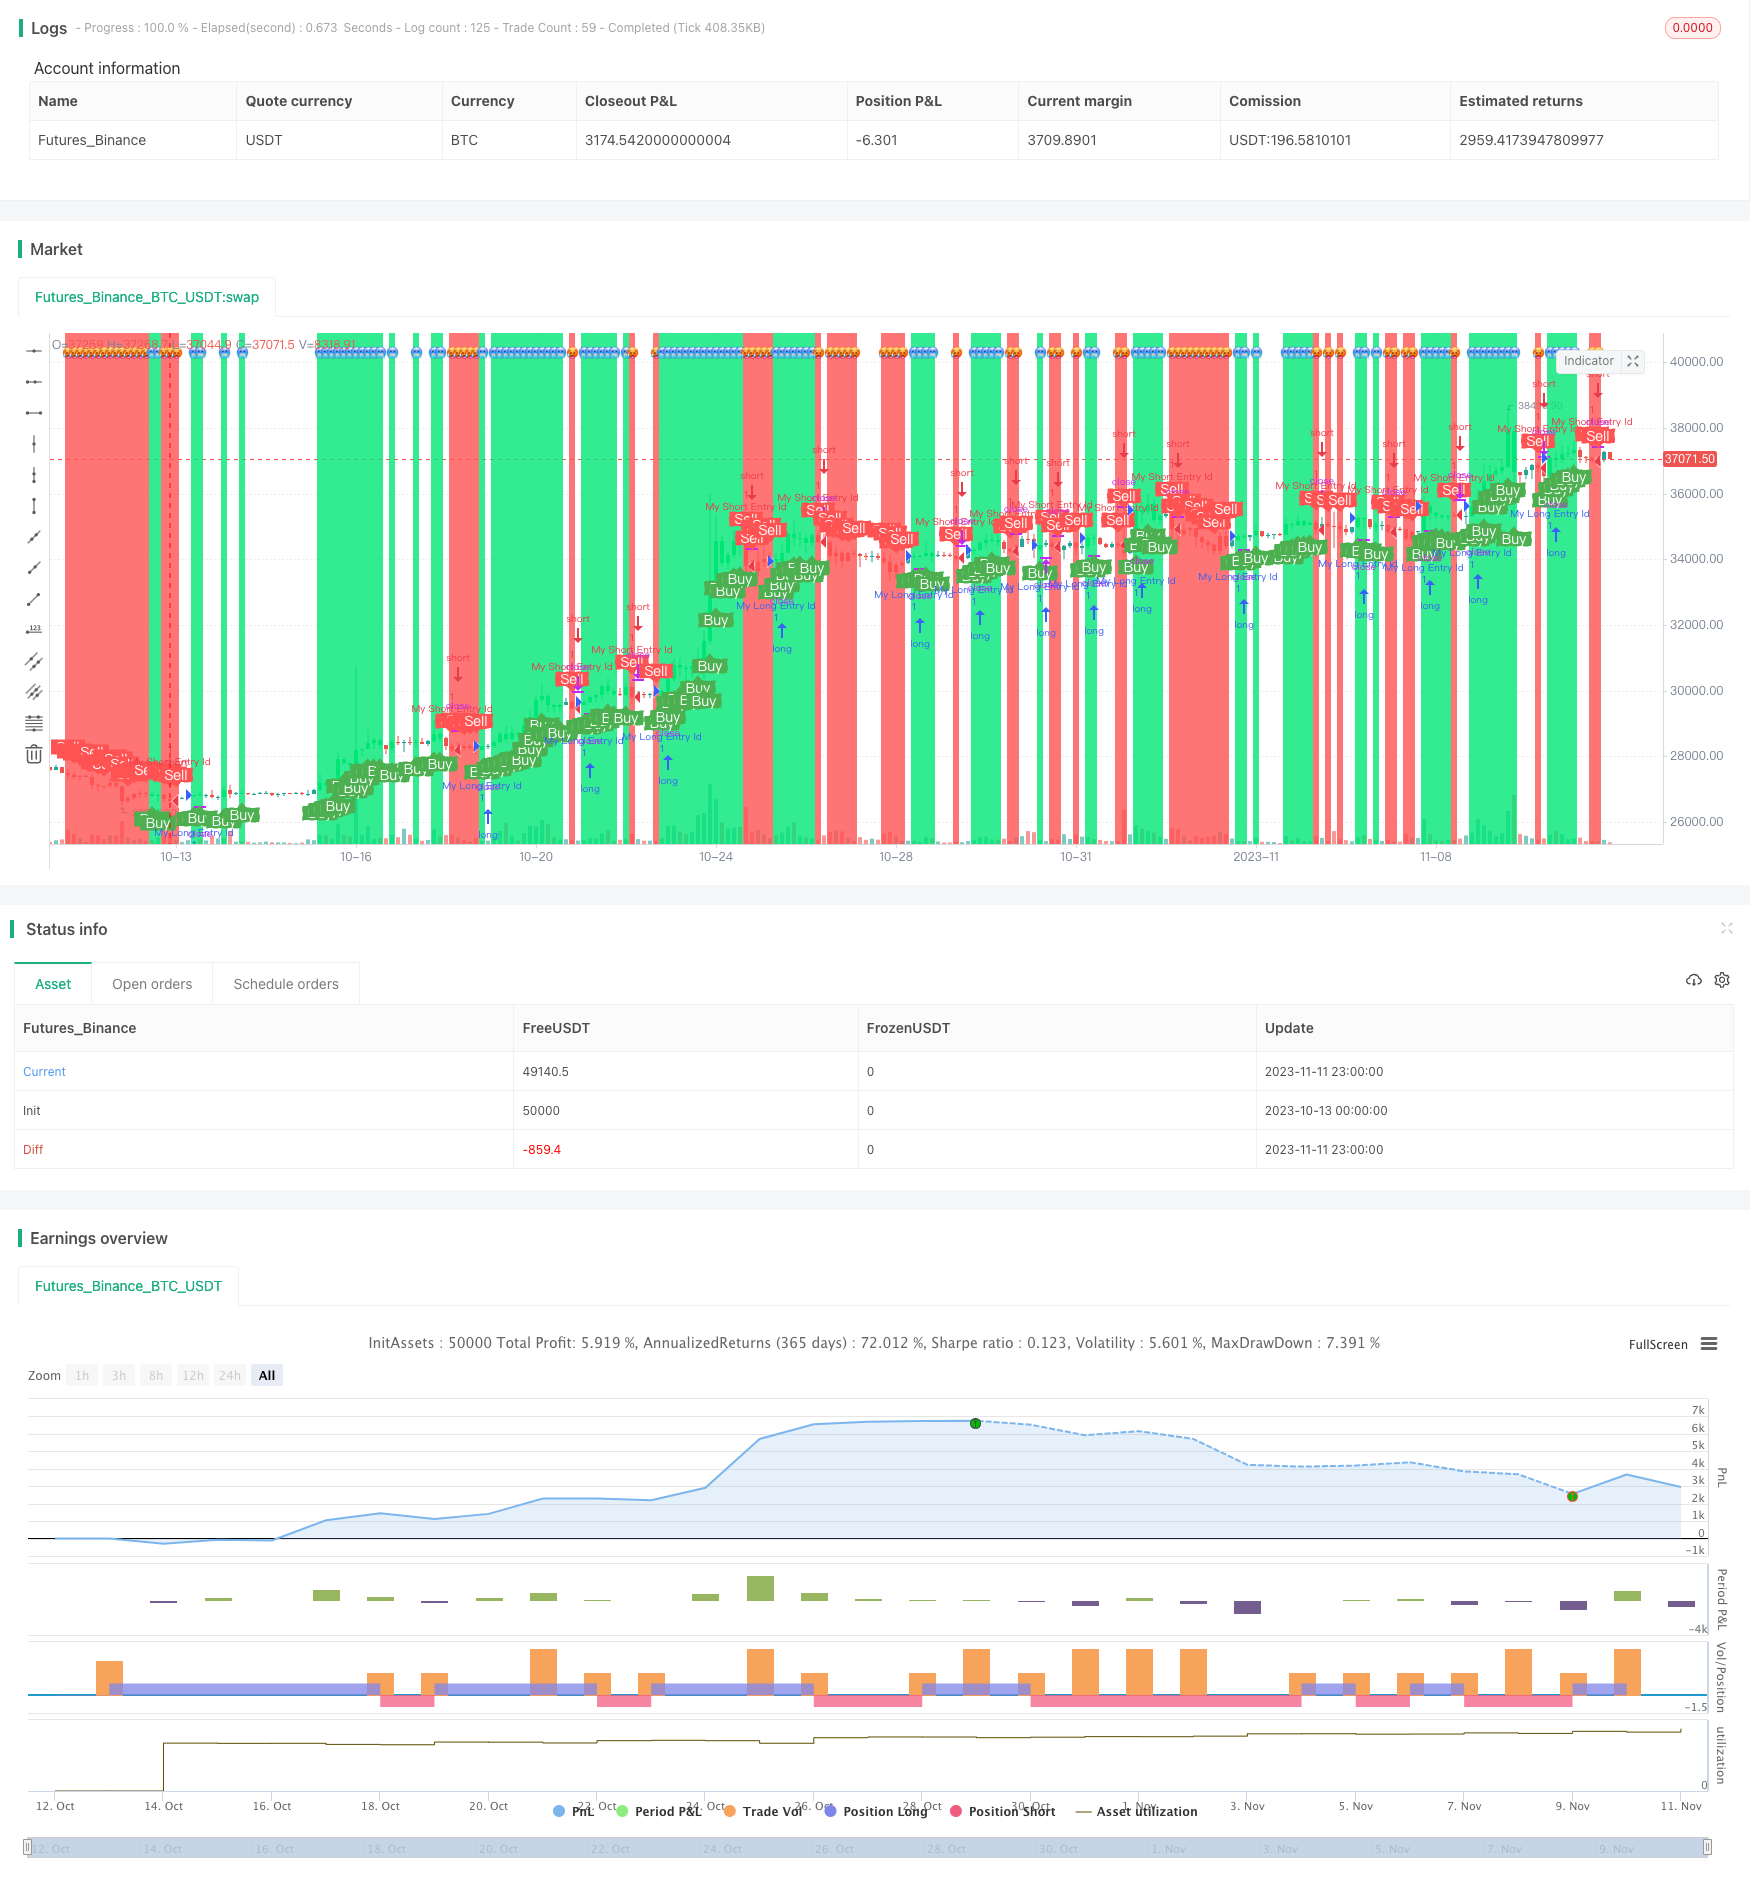
概述
本策略的目的是检测标的在特定时间段内的价格变动百分比,当超过设定的阈值时产生交易信号。该策略适用于短线和盘口交易,可以抓取突发行情变化带来的交易机会。
策略原理
输入参数x代表检查的K线周期数量,默认为5代表5分钟K线。
计算当前K线收盘价相对于x周期前收盘价的变动百分比,保存为trueChange1和trueChange2。
输入参数percentChangePos和percentChangeNeg代表设定的变动百分比阈值,默认为0.4%和-0.4%。
当trueChange1大于percentChangePos时,产生买入信号buy,当trueChange2小于percentChangeNeg时,产生卖出信号sell。
对buy和sell状态绘制文字和背景标记。
根据信号设置入场和出场条件。
配置报警和绘图。
策略优势
使用百分比变化而不是绝对价格变化,可自动调整参数适应不同标的。
可灵活设置阳性和阴性变动的百分比阈值,识别布林带两侧突破。
可调整检测周期参数,识别不同时间段内的趋势改变。
可配置报警提醒,确保重要信号不被遗漏。
简单直接的买卖信号逻辑,容易理解运用。
可在盘口捕捉短期行情反转机会。
策略风险
百分比变化无法判断趋势方向,可能产生误导信号。
默认参数可能不适合所有标的,需要针对性调整。
不存在止损手段,无法控制单笔损失。
信号频繁,交易成本可能较高。
无法判断市场结构,在震荡市中容易被套。
解决方法:
结合趋势线性回归等指标判断大趋势。
根据不同标的特点优化参数设置。
适当设置止损条件。
过滤信号,避免过于频繁交易。
根据更高时间周期判断市场结构,避免在震荡市盲目交易。
策略优化
增加止损机制,如跟踪止损、移动止损等,控制单笔损失。
增加过滤条件,如量能指标、移动均线等,避免被套。
优化买卖点设置,如结合MACD等指标确认信号。
采用机器学习方法自动优化参数。
增加对市场结构的判断,避免在震荡市盲目交易。
考虑标的的波动率、流动性等差异,动态设置参数。
结合高级别时间周期分析,判断大趋势方向。
总结
本策略通过比较价格变动百分比与预设阈值,判断买卖时机,属于短期反转策略。优点是简单直观,可配置灵活,适合捕捉突发行情。缺点是存在一定盈亏风险,需要配合趋势判断及风险控制手段运用。整体来说,该策略思路清晰易懂,通过合理优化可成为有效的短线交易策略。
/*backtest
start: 2023-10-13 00:00:00
end: 2023-11-12 00:00:00
period: 3h
basePeriod: 15m
exchanges: [{"eid":"Futures_Binance","currency":"BTC_USDT"}]
*/

//@version=4
// created by Oliver
strategy("Percentage Change strategy w/BG color", overlay=true, scale=scale.none, precision=2)

x = input(5, title = 'x candles difference', minval = 1)
trueChange1 = (close - close[x]) / close[x] * 100
percentChangePos = input(0.4, title="Percent Change")

//if (percentChange > trueChange) then Signal

plotChar1 = if percentChangePos > trueChange1
    false
else
    true

plotchar(series=plotChar1, char='🥶', color=color.green, location=location.top, size = size.tiny )

trueChange2 = (close - close[x]) / close[x] * 100
percentChangeNeg = input(-0.4, title="Percent Change")

plotChar2 = if percentChangeNeg < trueChange2
    false
else
    true
plotchar(series=plotChar2, char='🥵', color=color.red, location=location.top, size = size.tiny)

//------------------------------------------------------------------------
UpColor() => percentChangePos < trueChange1
DownColor() => percentChangeNeg > trueChange2

//Up = percentChangePos < trueChange1
//Down = percentChangeNeg > trueChange2


col = percentChangePos < trueChange1 ? color.lime : percentChangeNeg > trueChange2 ? color.red : color.white
//--------
condColor = percentChangePos < trueChange1 ? color.new(color.lime,50) : percentChangeNeg > trueChange2 ? color.new(color.red,50) : na
//c_lineColor = condUp ? color.new(color.green, 97) : condDn ? color.new(color.maroon, 97) : na
//barcolor(Up ? color.blue : Down ? color.yellow : color.gray, transp=70)

//Background Highlights
//bgcolor(condColor, transp=70)


//---------

barcolor(UpColor() ? color.lime: DownColor() ? color.red : na)
bgcolor(UpColor() ? color.lime: DownColor() ? color.red : na)

//------------------------------------------------------------------------

buy = percentChangePos < trueChange1
sell = percentChangeNeg > trueChange2


//------------------------------------------------------------------------
/////////////// Alerts ///////////////
alertcondition(buy, title='buy', message='Buy')
alertcondition(sell, title='sell', message='Sell')

//-------------------------------------------------

if (buy)
    strategy.entry("My Long Entry Id", strategy.long)

if (sell)
    strategy.entry("My Short Entry Id", strategy.short)


/////////////////// Plotting ////////////////////////
plotshape(buy, title="buy", text="Buy", color=color.green, style=shape.labelup, location=location.belowbar, size=size.small, textcolor=color.white, transp=0)  //plot for buy icon
plotshape(sell, title="sell", text="Sell", color=color.red, style=shape.labeldown, location=location.abovebar, size=size.small, textcolor=color.white, transp=0)