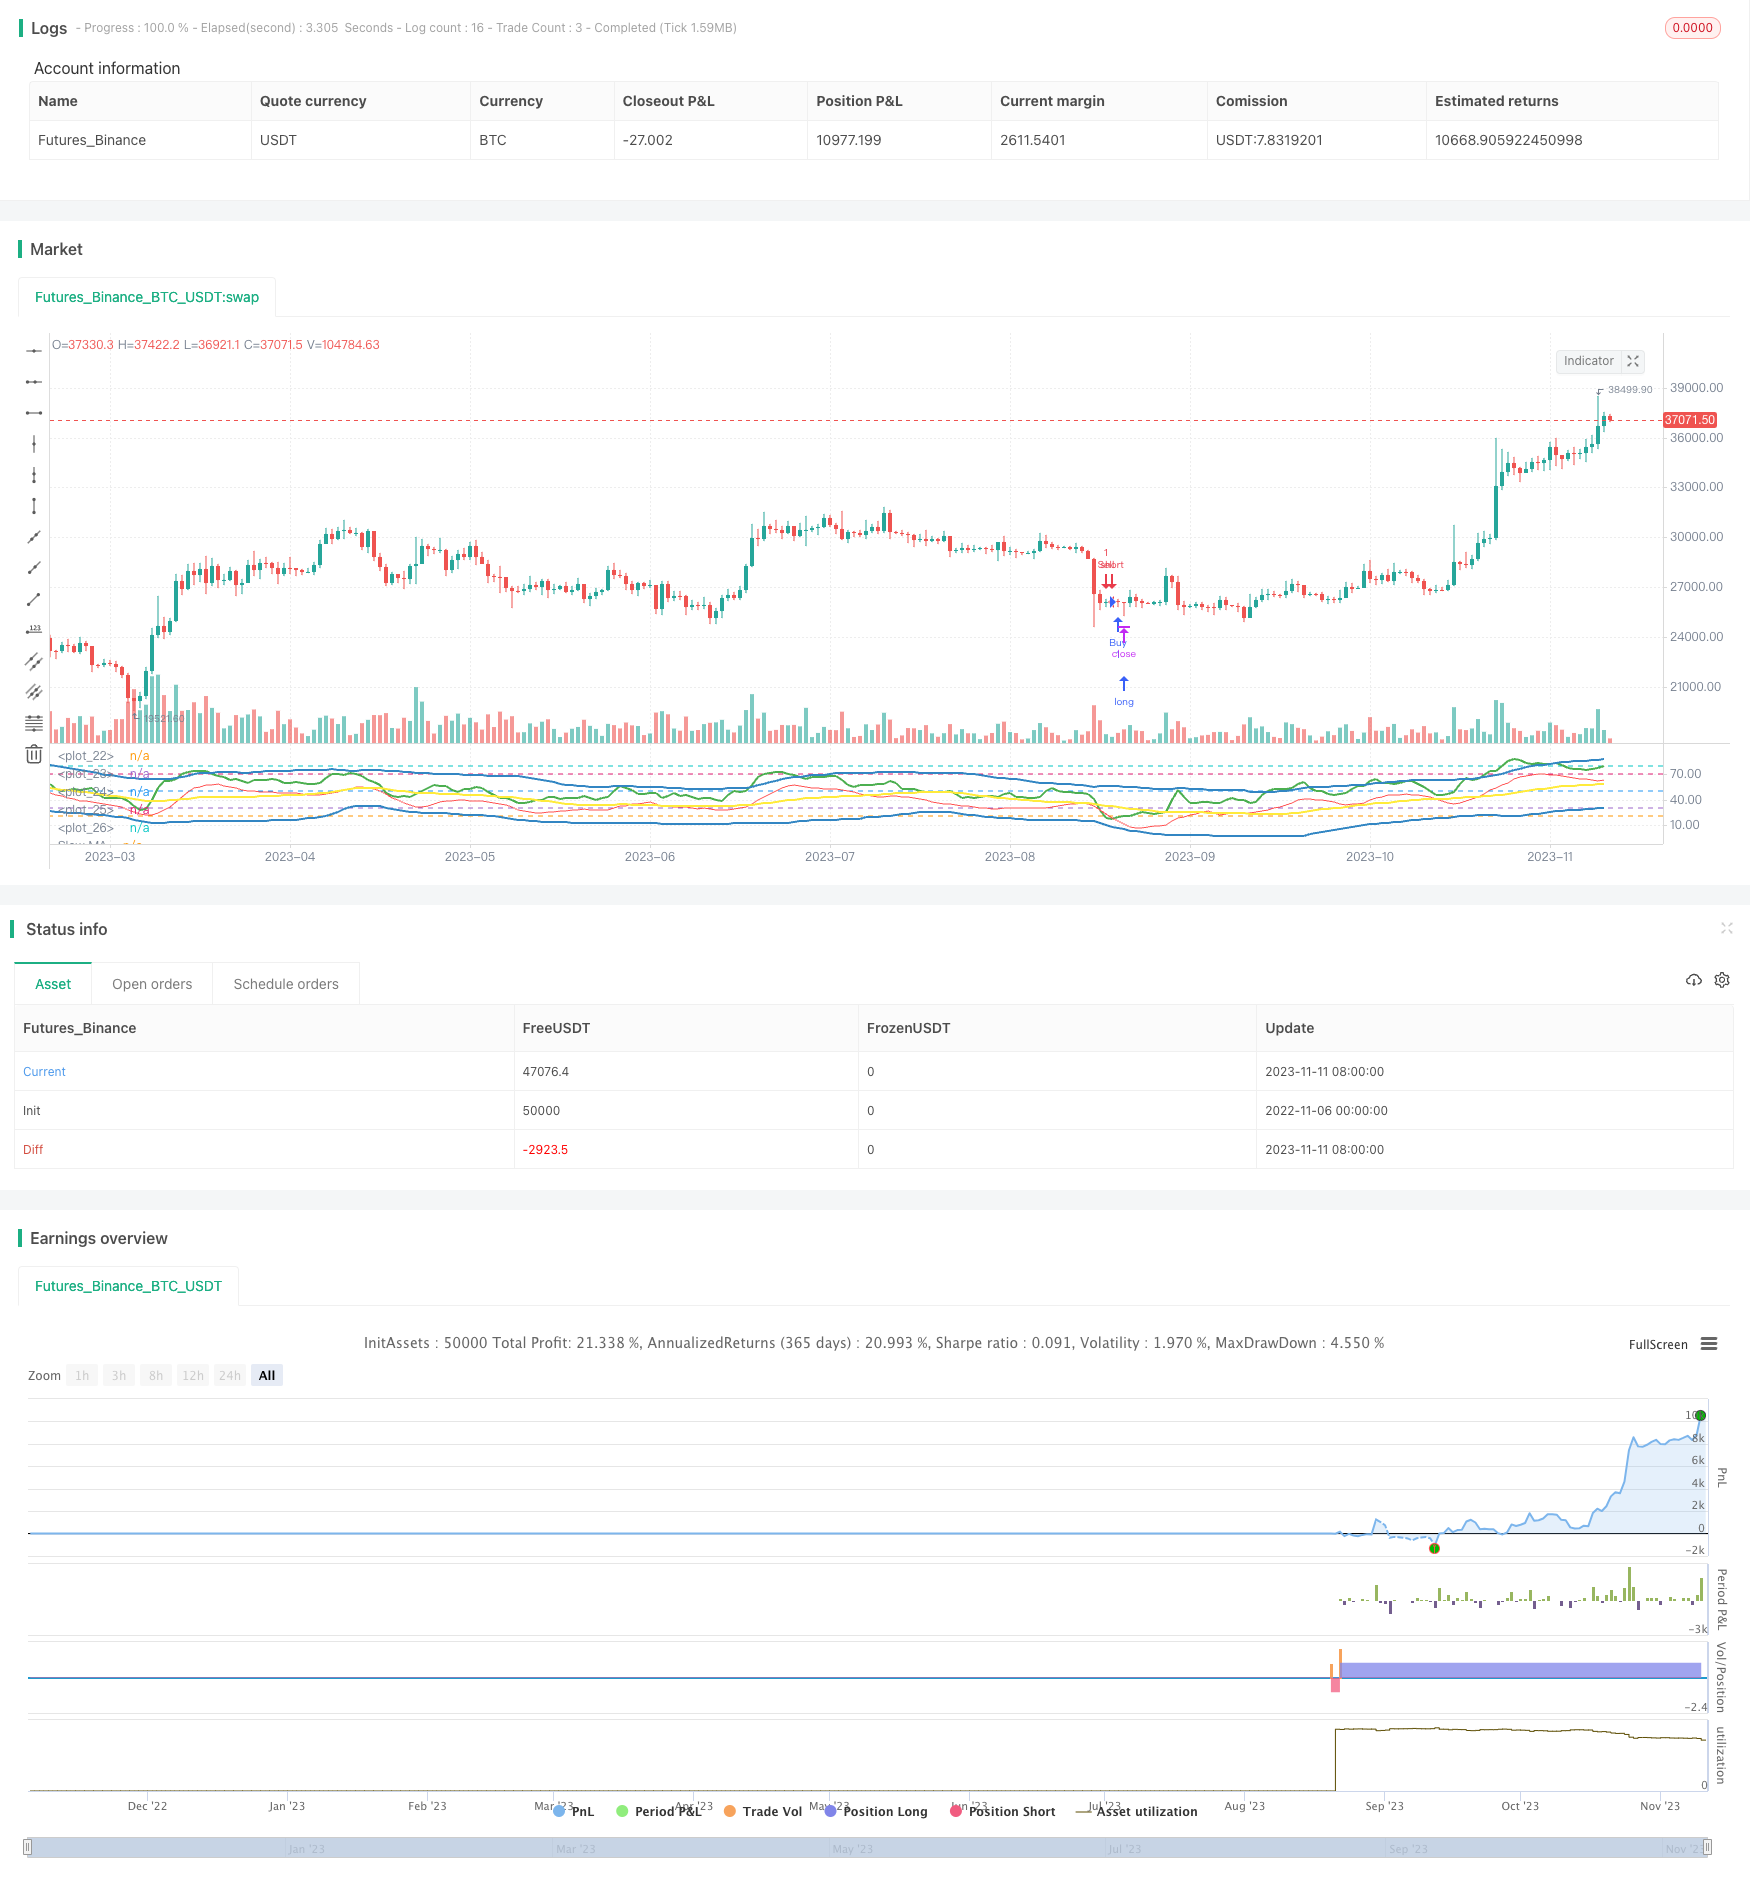
Traders Dynamic Index Strategy

Author: ChaoZhang, Date: 2023-11-13 10:09:48
Tags:

img

Overview

This strategy uses the Traders Dynamic Index (TDI) as the main technical indicator, combined with moving averages across different timeframes to generate trading signals. It aims to capture mean reversion opportunities during overbought and oversold conditions.

Strategy Logic

The strategy first calculates the RSI of close with a period of 13. Then it calculates the 34-period simple moving average of RSI, and uses 1.6185 times the 34-period standard deviation of RSI as the upper and lower bands. The upper band is the moving average plus the offset, and the lower band is the moving average minus the offset. The moving average is the middle band.

After that, it calculates the fast MA of RSI with a period of 2, and the slow MA of RSI with a period of 7. It then retrieves historical values of these indicators from a higher timeframe. When the fast MA crosses below the slow MA, a buy signal is generated. When the fast MA crosses above the slow MA, a sell signal is generated.

Advantage Analysis

This strategy utilizes the mean reversion characteristic of RSI and combines momentum indicators to implement reversal trading. The upper and lower bands of RSI reflect overbought and oversold conditions, while the middle band reflects the average price level. The crossover of the fast and slow MAs reflects momentum change and reversal opportunities. Overall, this strategy accurately captures reversal points with ideal drawdown control.

Specifically, the RSI bands set reasonable overbought and oversold thresholds to promptly detect anomalies. The middle band grasps the equilibrium price level. The fast MA filters out short-term noise and the slow MA determines the medium-term trend. Working together, they can effectively identify reversal opportunities. In addition, the combination of indicators across different timeframes enables the strategy to confirm across multiple time horizons, reducing the risk of false signals.

Risk Analysis

This strategy is mainly based on mean reversion, which has inherent timing risks. Consecutive losses could occur if the market undergoes a prolonged irrational expansion, such as a short squeeze. Also, failure to properly set the fast and slow MAs may cause missed reversal opportunities or false signals. Some degree of parameter optimization is necessary.

To control the above risks, it is advisable to adjust the MA periods reasonably or add stop loss mechanisms. When the market enters an irrational regime, position sizes should be reduced or trading stopped altogether. Overall, adapting the strategy to specific market environments is key.

Optimization Directions

The strategy can be optimized in the following aspects:

  1. Test RSI periods of different lengths to find settings more suitable for current market conditions.

  2. Optimize the lengths of the fast and slow MAs to balance catching reversals and filtering out noise.

  3. Add volatility-based stop loss to control maximum drawdown.

  4. Try adding other factors like volume change in entry logic to improve accuracy.

  5. Test the effect of reusing the same set of trading signals across multiple timeframes.

  6. Develop adaptive optimization mechanisms for dynamic parameter adjustment.

Conclusion

The overall framework of this RSI reversal strategy is reasonable with clear and interpretable logic. It has customizable space and optimization potential. With proper parameter tuning and risk control, its ability to capture reversals is promising. The next step is to further optimize the strategy through more backtesting and parameter adjustment, to improve its robustness and profitability.


/*backtest
start: 2022-11-06 00:00:00
end: 2023-11-12 00:00:00
period: 1d
basePeriod: 1h
exchanges: [{"eid":"Futures_Binance","currency":"BTC_USDT"}]
*/

//@version=2

strategy("TDI - Traders Dynamic Index [Mehdi]", shorttitle="TDIMEHDI")

rsiPeriod = input(13, minval = 1, title = "RSI Period")
bandLength = input(34, minval = 1, title = "Band Length")
lengthrsipl = input(7, minval = 0, title = "Fast MA on RSI")
lengthtradesl = input(2, minval = 1, title = "Slow MA on RSI")
p1 = input("15", title = "Signal Timeframe")

src = close                                                             // Source of Calculations (Close of Bar)

r = rsi(src, rsiPeriod)                                                 // RSI of Close
ma = sma(r, bandLength)                                                 // Moving Average of RSI [current]
offs = (1.6185 * stdev(r, bandLength))                                  // Offset
up = ma + offs                                                          // Upper Bands
dn = ma - offs                                                          // Lower Bands
mid = (up + dn) / 2                                                     // Average of Upper and Lower Bands
fastMA = sma(r, lengthrsipl)                                            // Moving Average of RSI 2 bars back
slowMA = sma(r, lengthtradesl)                                          // Moving Average of RSI 7 bars back

hline(20)                                                               // ExtremelyOversold
hline(30)                                                               // Oversold
hline(50)                                                               // Midline
hline(70)                                                               // Overbought
hline(80)                                                               // ExtremelyOverbought

up1 = request.security(syminfo.tickerid, p1, up)
dn1 = request.security(syminfo.tickerid, p1, dn)
mid1 = request.security(syminfo.tickerid, p1, mid)
slowMA1 = request.security(syminfo.tickerid, p1, slowMA)
fastMA1 = request.security(syminfo.tickerid, p1, fastMA)

plot(up1, "Upper Band", color = #3286c3, linewidth = 2)               // Upper Band
plot(dn1, "Lower Band", color = #3286c3, linewidth = 2)               // Lower Band
plot(mid1, "Middle of Bands", color = yellow, linewidth = 2)      // Middle of Bands
plot(slowMA1, "Slow MA", color=green, linewidth=2)                       // Plot Slow MA
plot(fastMA1, "Fast MA", color=red, linewidth=1)                         // Plot Fast MA

if (crossover(slowMA1, fastMA1))
    strategy.entry("Buy", strategy.long, comment="Buy")

if (crossunder(slowMA1, fastMA1))
    strategy.entry("Sell", strategy.short, comment="Sell")

More