RSI Pullback Breakout Strategy

Author: ChaoZhang, Date: 2023-11-13 10:15:48
Tags:

img

Overview

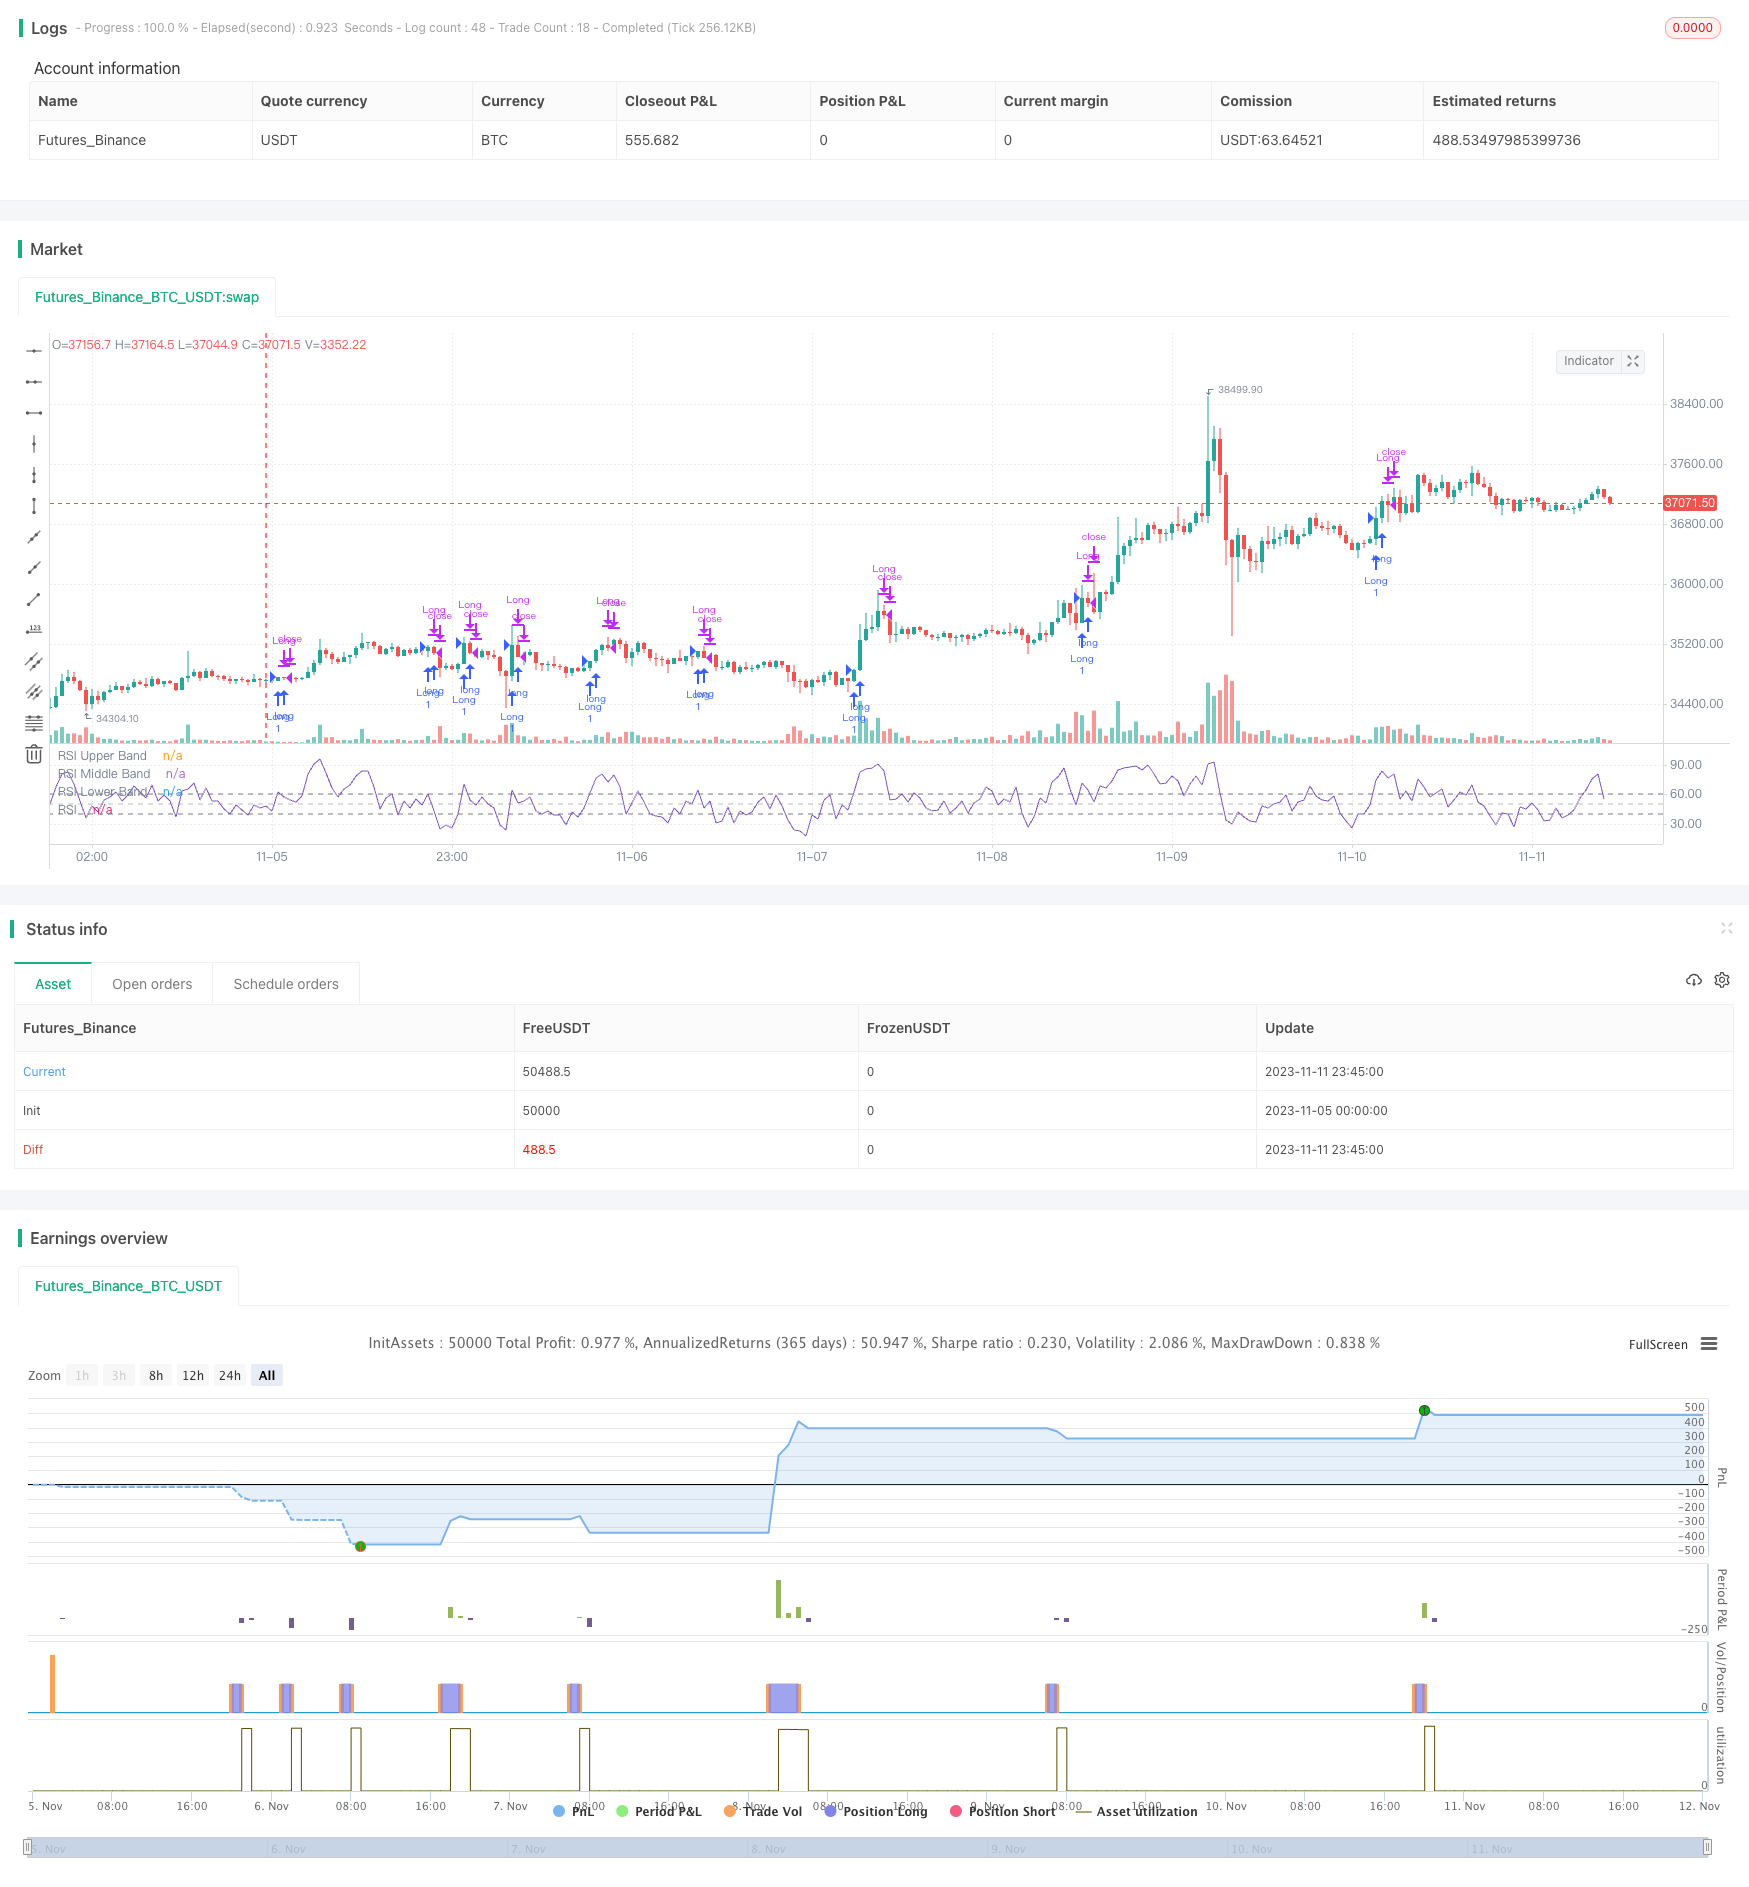
The RSI pullback breakout strategy is a short-term trading strategy based on the Relative Strength Index (RSI) indicator. It identifies oversold pullback opportunities by looking for RSI breakouts on the upside after the price has declined sharply, aiming to capture rebounds for profits.

Strategy Logic

The strategy determines entry signals based on the RSI indicator. The specific logic is:

  1. Use RSI with a length of 5. A breakout above 60 on the RSI is considered a buy signal.

  2. The RSI breaking above 60 represents the stock has declined significantly in the short term, performing weakly. The RSI crossing above 60 may signal a price bounce.

  3. When RSI breaks through 60, open a long position using market orders.

  4. When RSI falls back below its value from the previous period, i.e. RSI < RSI[1], it is considered an exit signal to close positions.

The strategy mainly relies on RSI to identify short-term oversold pullback opportunities, capturing rebounds for profits. It uses RSI pullbacks to determine timing of rebounds after successive price declines have pushed RSI into oversold levels.

Advantage Analysis

The advantages of this strategy include:

  1. The logic is simple and clear, easy to understand and implement, suitable for beginners.

  2. It uses the mature RSI indicator, providing some practical utility.

  3. RSI pullback breakouts help identify some oversold bounce opportunities.

  4. High trading frequency allows capturing short-term price swings.

  5. Controllable risk due to use of stop losses.

Risk Analysis

There are also some risks:

  1. RSI has some lag, which may cause inaccurate entry signals.

  2. Price bounces may not sustain and could re-break stop loss levels.

  3. High trading frequency leads to possibly high transaction costs.

  4. Parameters like RSI length, entry criteria need continuous optimization.

  5. Singular long/short basis means too many false signals in persistent uptrend/downtrend.

Enhancement Opportunities

Some ways to enhance the strategy:

  1. Add trend filter to avoid whipsaws in range-bound periods.

  2. Incorporate machine learning models for multifactor prediction to improve entry accuracy.

  3. Optimize stop loss for locking in more profits using trailing stops.

  4. Adjust holding period for long-term vs short-term holdings.

  5. Add volatility filter to only consider buying after sharp declines.

Summary

The strategy is relatively simple and direct, using RSI pullback breakouts to determine entries. It has some practical utility in identifying short-term oversold bounces. However, inherent lag in RSI and singular long/short basis are issues. Enhancements like multifactor prediction, stop loss optimization, trend filters can improve strategy performance.


/*backtest
start: 2023-11-05 00:00:00
end: 2023-11-12 00:00:00
period: 45m
basePeriod: 5m
exchanges: [{"eid":"Futures_Binance","currency":"BTC_USDT"}]
*/

//@version=5
strategy("*RSI 5 - Long only- Daily charts & above*", overlay = false)

// Define inputs
rsi_length = input(5, "RSI Length")

// Calculate indicators
rsi = ta.rsi(close, rsi_length)

// Entry conditions
long = rsi[1] < 50 and rsi > 60

// Exit conditions
longExit = rsi < rsi[1] 


// Execute trade with adjusted position size
if (long) 
    strategy.entry("Long", strategy.long)
    
    
if  (longExit)
	strategy.close("LongExit")


// Close long position if long exit condition is met
if (longExit)
    strategy.close("Long", comment="Long exit")

rsiPlot = plot(rsi, "RSI", color=#7E57C2)
rsiUpperBand = hline(60, "RSI Upper Band", color=#787B86)
midline = hline(50, "RSI Middle Band", color=color.new(#787B86, 50))
rsiLowerBand = hline(40, "RSI Lower Band", color=#787B86)
fill(rsiUpperBand, rsiLowerBand, color=color.rgb(126, 87, 194, 90), title="RSI Background Fill")


More