Dynamic Moving Average Crossover Trading Strategy

Author: ChaoZhang, Date: 2023-11-13 10:27:54
Tags:

img

Overview

The key idea of this strategy is to build multiple moving averages based on the Ratio OCHL Averager indicator of different timeframes and generate trading signals based on the crossover. It can dynamically capture the price trend and is suitable for medium-term trading.

Strategy Logic

The strategy uses two Ratio OCHL Averager indicators with different timeframes as the fast and slow lines. The Ratio OCHL Averager is calculated as:

b = abs(close-open)/(high - low)
c = min(max(b, 0), 1)  
Ratio OCHL Averager = c*close + (1-c)*previous Ratio OCHL Averager

Here b represents the intraday price movement ratio and c is the normalized b. The Ratio OCHL Averager incorporates open, close, high and low prices to build the moving average.

The strategy sets a shorter period for the fast line and a longer period for the slow line. A buy signal is generated when the fast line crosses above the slow line, and a sell signal when the fast line crosses below. It captures the trend by the moving average crossover logic.

Advantages

  1. The Ratio OCHL Averager smoothes the price data and filters out market noise, making the trading signal more reliable.

  2. The dual moving average crossover combined with different timeframes can better detect the start of a new trend.

  3. The periods of the fast and slow line can be adjusted for different market conditions.

  4. The strategy logic is simple and intuitive. Easy to understand and implement.

  5. Stop loss and take profit can be flexibly set to control risks.

Risks

  1. Moving average crossover may generate excessive false signals. Other technical indicators may be needed for filtration.

  2. The periods of the fast and slow line should be reasonably chosen, otherwise it may affect the strategy performance.

  3. It is a trend following strategy not suitable for range-bound market. Should be used in trending conditions.

  4. Stop loss and take profit should be adjusted properly to reduce loss and optimize profit level.

Optimization Directions

  1. Consider combining momentum indicators like MACD, KDJ for signal filtration and quality improvement.

  2. Test different fast and slow line period combinations to find the optimal parameters.

  3. Optimize the stop loss and take profit based on backtest results.

  4. Consider dynamically adjusting parameters in certain market conditions, for example, increase the period in a range-bound market.

Conclusion

The strategy has a clear logic of using fast and slow moving average crossover to determine trend direction. It is a dynamic trend following strategy suitable for medium-term trading. There is still much room for optimization by parameters tuning, signal filtration etc. Overall it is a flexible and practical trend trading strategy.
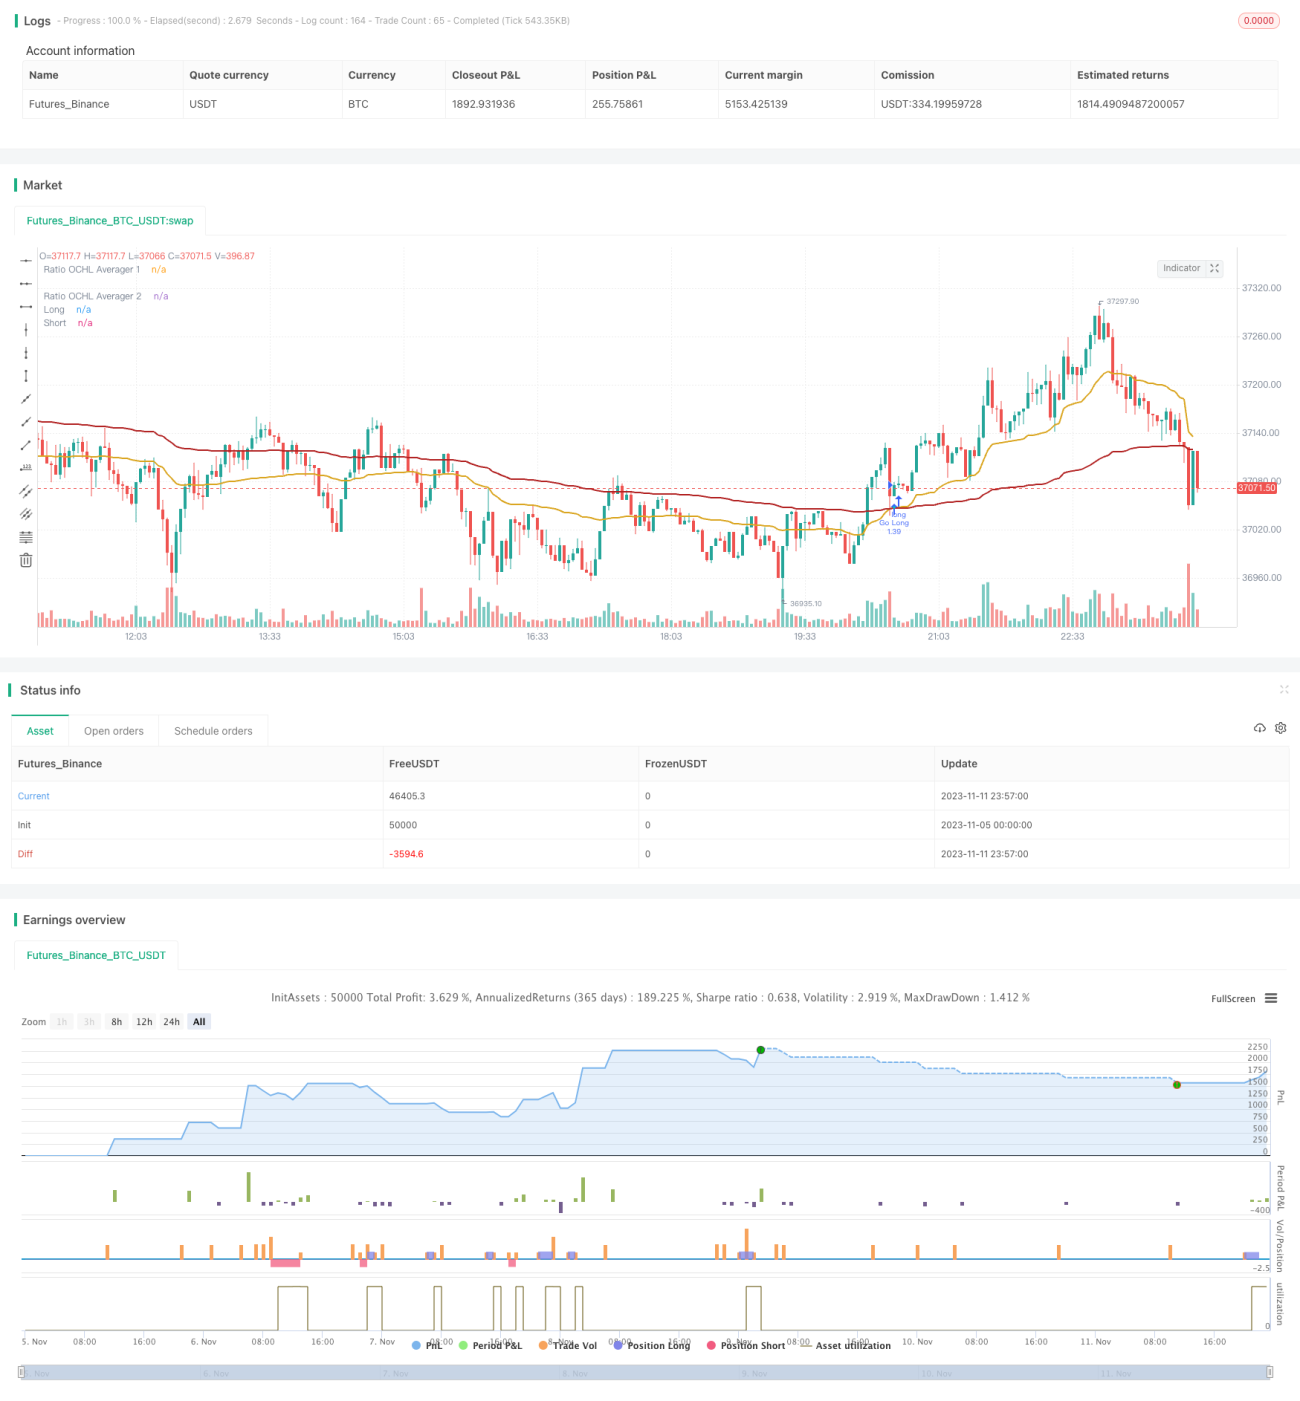

/*backtest
start: 2023-11-05 00:00:00
end: 2023-11-12 00:00:00
period: 3m
basePeriod: 1m
exchanges: [{"eid":"Futures_Binance","currency":"BTC_USDT"}]
*/

//@version=4
strategy(title="[XC] Adaptive Strategy V3 - Ratio OCHL Averager no repaint",shorttitle="R_OHCL", overlay=true, currency=currency.EUR,initial_capital=10000,
     default_qty_value=100, default_qty_type=strategy.percent_of_equity , calc_on_every_tick=false, calc_on_order_fills=true)


//                  ╔═ SETTINGS                  ╗
//░░░░░░░░░░░░░░░░░ ╚════════════════════════════╝ ░░░░░░░░░░░░░░░░░░░░░░░░

strategy_1     = input ( defval=true   , type=input.bool    , title="STRATEGY 1? —>"      )
Recursive      = input(false)
RES201         = "Min",RES202= "D",RES203 = "W",RES204 = "M"

//++ Resolution 1 ++
inp_resolution1 = input(600, minval=1, title="Resolution Line 1")
restype1        = input ( defval="Min"  , type=input.string , title= "Resolution Line 1" , options=[ "Min","D","W","M"])
multiplier1     = restype1 == "Min" ? "" : restype1 == "D" ? "D" : restype1 == "W" ? "W" : "M"
resolution1     = tostring(inp_resolution1)+ multiplier1

//++ Resolution 2 ++
inp_resolution2 = input(1440, minval=1, title="Resolution Line 2")
restype2        = input ( defval="Min"  , type=input.string , title= "Resolution Line 2" , options=["Min","D","W","M"])
multiplier2     = restype2 == "Min" ? "" : restype2 == "D" ? "D" : restype2 == "W" ? "W" : "M"
resolution2     = tostring(inp_resolution2)+ multiplier2

StopLoss        = input(defval = 500 , title = "Stop Loss", minval = 0)
TakeProfit      = input(defval = 2500 , title = "Take Profit", minval = 0)
// === RISK MANAGEMENT VALUE PREP ===
// if an input is less than 1, assuming not wanted so we assign 'na' value to disable it.
useTakeProfit   = TakeProfit  >= 1 ? TakeProfit  : na
useStopLoss     = StopLoss    >= 1 ? StopLoss    : na


//                  ╔═ BACKTEST RANGE            ╗
//░░░░░░░░░░░░░░░░░ ╚════════════════════════════╝ ░░░░░░░░░░░░░░░░░░░░░░░░
line_breakBTR  = input ( defval = true   , type=input.bool   , title="BACKTEST RANGE —"      ) 
FromYear       = input ( defval = 2019, title = "From Year", minval = 2017)
FromMonth      = input ( defval = 1, title = "From Month", minval = 1, maxval = 12)
FromDay        = input ( defval = 2, title = "From Day", minval = 1, maxval = 31)
//FromHour     = input ( defval = 1, title = "From Hour", minval = 1, maxval = 24)
ToYear         = input ( defval = 9999, title = "To Year", minval = 2017)
//ToHour       = input ( defval = 0, title = "From Hour", minval = 0, maxval = 24)
ToMonth        = input ( defval = 1, title = "To Month", minval = 1, maxval = 12)
ToDay          = input ( defval = 1, title = "To Day", minval = 1, maxval = 31)

// === FUNCTION EXAMPLE ===
start     = timestamp(syminfo.timezone, FromYear, FromMonth, FromDay, 0, 00)  // backtest start window
finish    = timestamp(syminfo.timezone, ToYear  , ToMonth  , ToDay  , 0, 59)  // backtest finish window
window()  => time >= start and time <= finish ? true : false // create function "within window of time"

//                  ╔═ INDICATOR                 ╗
//░░░░░░░░░░░░░░░░░ ╚════════════════════════════╝ ░░░░░░░░░░░░░░░░░░░░░░░░

// "Ratio OCHL Averager" -> alexgrover / tradingview.com/script/RGAtOI6h-Ratio-OCHL-Averager-An-Alternative-to-VWAP/

rochla( res,Recursive)=>
    //Recursive = false
    H =  security(syminfo.tickerid,res,high[1],gaps = barmerge.gaps_off,  lookahead = barmerge.lookahead_on)
    L =  security(syminfo.tickerid,res,low[1] ,gaps = barmerge.gaps_off,  lookahead = barmerge.lookahead_on)
    d = 0.
    //----
    a = Recursive ? nz(d[1],open) : open
    b = abs(close-a)/(H - L)
    c = b > 1 ? 1 : b
    d := c*close+(1-c)*nz(d[1],close)


strat1_line1=rochla(resolution1,Recursive)
strat1_line2=rochla(resolution2,Recursive)

plot(strat1_line1, title="Ratio OCHL Averager 1", color=#DAA520,linewidth=2,transp=0)
plot(strat1_line2, title="Ratio OCHL Averager 2", color=#B22222,linewidth=2,transp=0)


//                  ╔═ STRATEGY 1                ╗
//░░░░░░░░░░░░░░░░░ ╚════════════════════════════╝ ░░░░░░░░░░░░░░░░░░░░░░░░

trading_strat1_line1 = strategy_1 == 1    ? strat1_line1   : na
trading_strat1_line2 = strategy_1 == 1    ? strat1_line2   : na

longCross  = crossunder (trading_strat1_line2, trading_strat1_line1) ? true : false
shortCross = crossover  (trading_strat1_line2, trading_strat1_line1) ? true : false

plot( longCross  ? trading_strat1_line1 : na , title = "Long"  , color=color.aqua, style=plot.style_circles, linewidth=5, offset= 0)
plot( shortCross ? trading_strat1_line2 : na , title = "Short" , color=color.red , style=plot.style_circles, linewidth=5, offset= 0)


//                  ╔═ Backtest 1                ╗
//░░░░░░░░░░░░░░░░░ ╚════════════════════════════╝ ░░░░░░░░░░░░░░░░░░░░░░░░


strategy.exit("close",loss = useStopLoss, profit = useTakeProfit)

if longCross  and window() and strategy_1 == 1 
    strategy.entry("Go Long", strategy.long)
if shortCross and window() and strategy_1 == 1 
    strategy.entry("Go Short", strategy.short)

//end

More