Dual Moving Average Crossover Strategy

Overview
The Dual Moving Average Crossover Strategy is a common trend following strategy. It uses two moving averages of different periods to identify trend direction and generate trading signals based on their crossover. Specifically, when the shorter period moving average crosses above the longer period one, a golden cross is formed, indicating an upward trend. Oppositely, when the shorter MA crosses below the longer MA, a death cross is formed, indicating a downward trend.
Strategy Logic
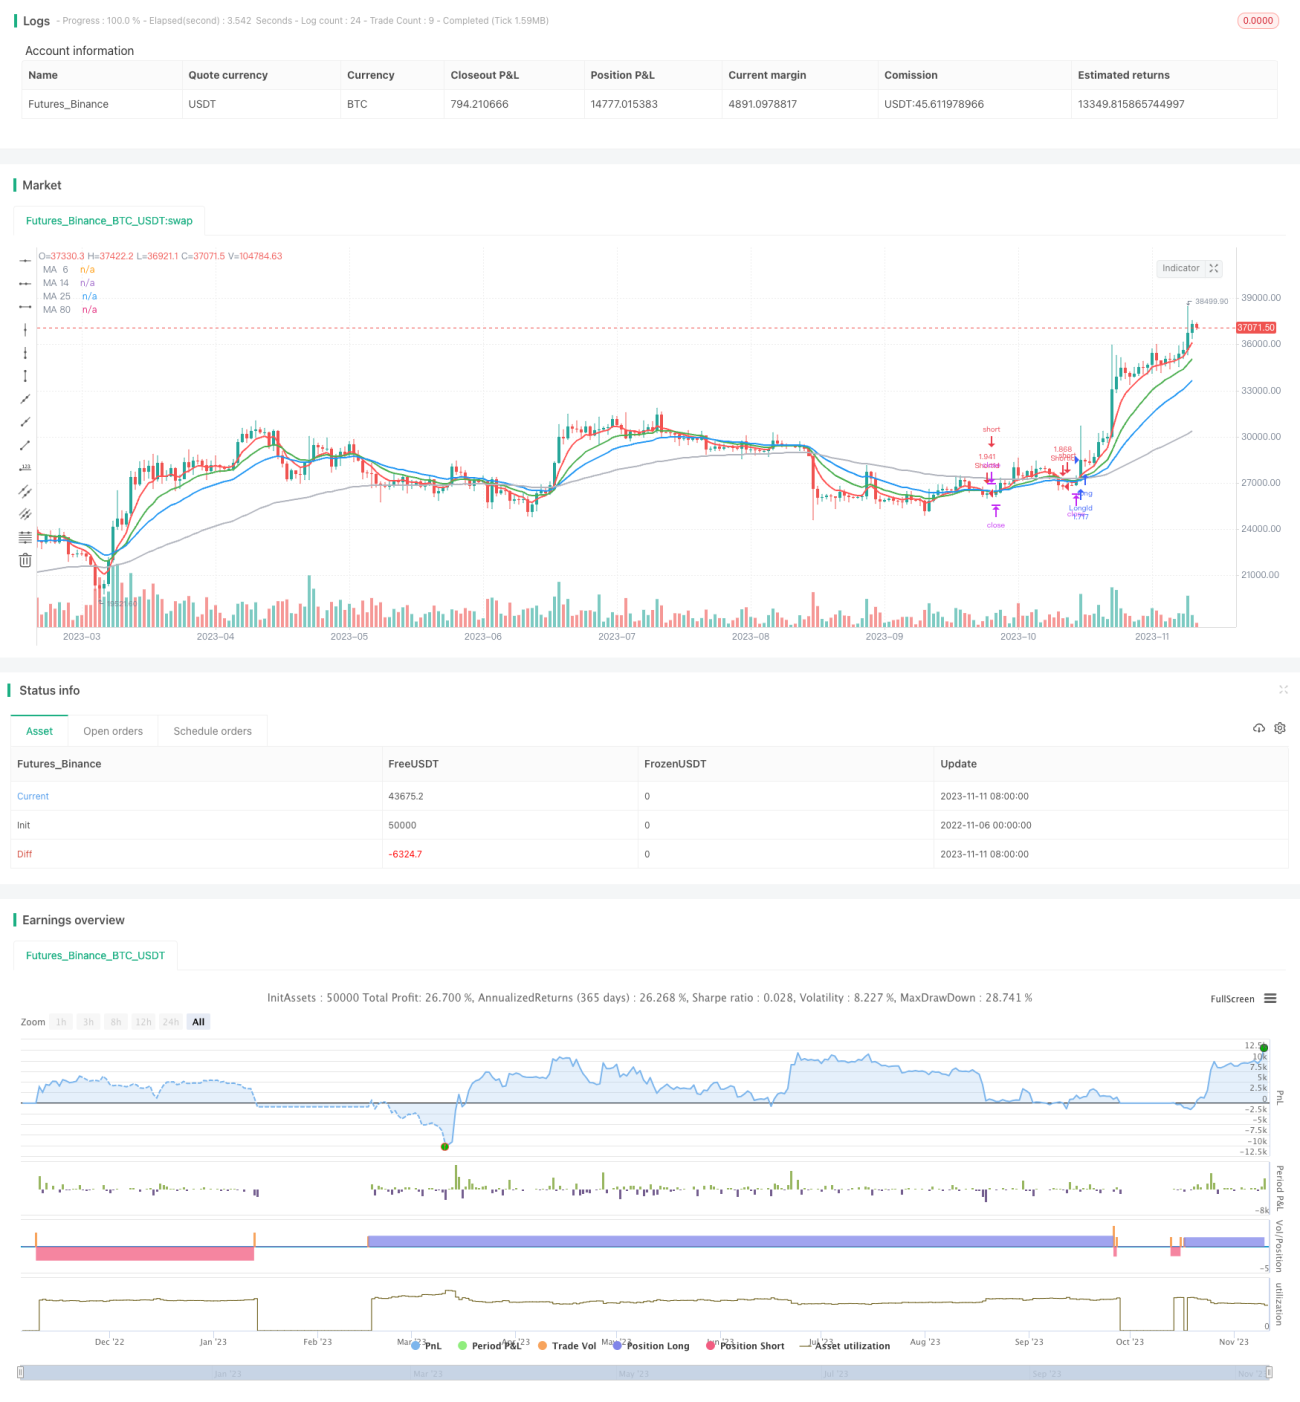
The strategy mainly utilizes 6-period, 14-period, 25-period and 80-period EMA lines. It first calculates these MA values, then identifies trend direction based on the crossover between the 6-period EMA and the other three MAs.
When the 6-period EMA crosses above either the 14-period or 25-period EMA, and it is above the 80-period EMA, a buy signal is generated. This indicates the short-term MA is breaking the medium to long-term MAs, and an upward trend may start, so we can consider buying.
Conversely, when the 6-period EMA crosses below either the 14-period or 25-period EMA, and it is below the 80-period EMA, a sell signal is generated. This indicates the short-term MA is broken by medium to long-term MAs, and a downward trend may start, so we can consider selling.
Upon signal generation, the strategy will open long or short positions. It also has a stop loss logic to exit positions when loss exceeds a threshold to control risk.
Advantage Analysis
The advantages of this strategy are:
-
Using MA crossover to determine trend is a mature and reliable technical indicator.
-
Combining multiple timeframes reduces false signals. The 6-period MA generates signals, while the 14-period, 25-period MAs confirm, and the 80-period MA defines overall trend.
-
The stop loss controls risk and protects capital effectively.
-
The logic is simple and clear, easy to understand and validate.
-
MA periods can be tuned to optimize for changing market conditions.
Risk Analysis
Some risks of this strategy include:
-
Price may whipsaw around MAs during ranging, generating excessive invalid signals. MA periods can be adjusted accordingly.
-
Fixed stop loss may be too rigid. Consider using trailing stop or dynamic stop instead.
-
Risk of stop loss being hit by sudden price gaps. Add additional logic to skip stop loss in such cases.
-
Unable to respond to short-term price fluctuations. Add filters using other indicators.
-
Limited optimization space. Consider using adaptive moving averages.
Optimization Directions
Some ways to optimize the strategy:
-
Test different MA period combinations to find parameters more sensitive to the market.
-
Improve stop loss mechanism using trailing or dynamic stops to reduce stop run risk.
-
Add filter indicators like KDJ, MACD to avoid excessive trades during ranging.
-
Optimize entry rules, wait for MA crossover to fully form before entering to reduce false signals.
-
Employ adaptive moving averages that automatically adjust periods based on volatility.
-
Add position sizing rules to adjust position size based on market conditions.
-
Incorporate profit taking exits.
Summary
In summary, this dual moving average crossover strategy identifies trend direction easily based on simple MA crossover logic, and has controllable risk. It is suitable for tracking medium to long term trends. But the strategy has ample room for optimization, via entry rules, stop loss techniques, filter conditions etc. Overall it serves as a solid baseline trend following strategy, with reasonable pros and cons. It is worth learning and practicing.
/*backtest
start: 2022-11-06 00:00:00
end: 2023-11-12 00:00:00
period: 1d
basePeriod: 1h
exchanges: [{"eid":"Futures_Binance","currency":"BTC_USDT"}]
*/

//@version=3
strategy(title = " bhramaji EMA Cross Strategy", shorttitle = "EMA Cross",calc_on_order_fills=true,calc_on_every_tick =true, initial_capital=21000,commission_value=.25,overlay = true,default_qty_type = strategy.percent_of_equity, default_qty_value = 100)
StartYear = input(2018, "Backtest Start Year")
StartMonth = input(1, "Backtest Start Month")- 1