概述
威廉姆斯鳄鱼策略是一种趋势跟踪策略,它利用三条不同周期的移动平均线形成的“鳄鱼口”形态判断趋势方向。当快线高于中线、中线高于慢线时,形成上升趋势的鳄鱼口,做多;当快线低于中线、中线低于慢线时,形成下降趋势的鳄鱼口,做空。该策略以Bill Williams发明的鳄鱼指标为基础,结合了移动平均线的趋势判断能力,可以有效捕捉市场趋势。
策略原理
该策略使用3条不同周期长度的SMA移动平均线,即快线sma1、中线sma2和慢线sma3。其中,sma1周期最短,sma3周期最长。
当sma1上穿sma2,且sma2上穿sma3时,表明市场处于上升趋势,形成上升鳄鱼口,根据趋势交易理论,这时应该入场做多。
反之,当sma1下穿sma2,且sma2下穿sma3时,表明市场处于下降趋势,形成下降鳄鱼口,这时应该入场做空。
做多和做空的出场条件为三条均线重新排列,快线低于中线或中线低于慢线,此时应平仓。
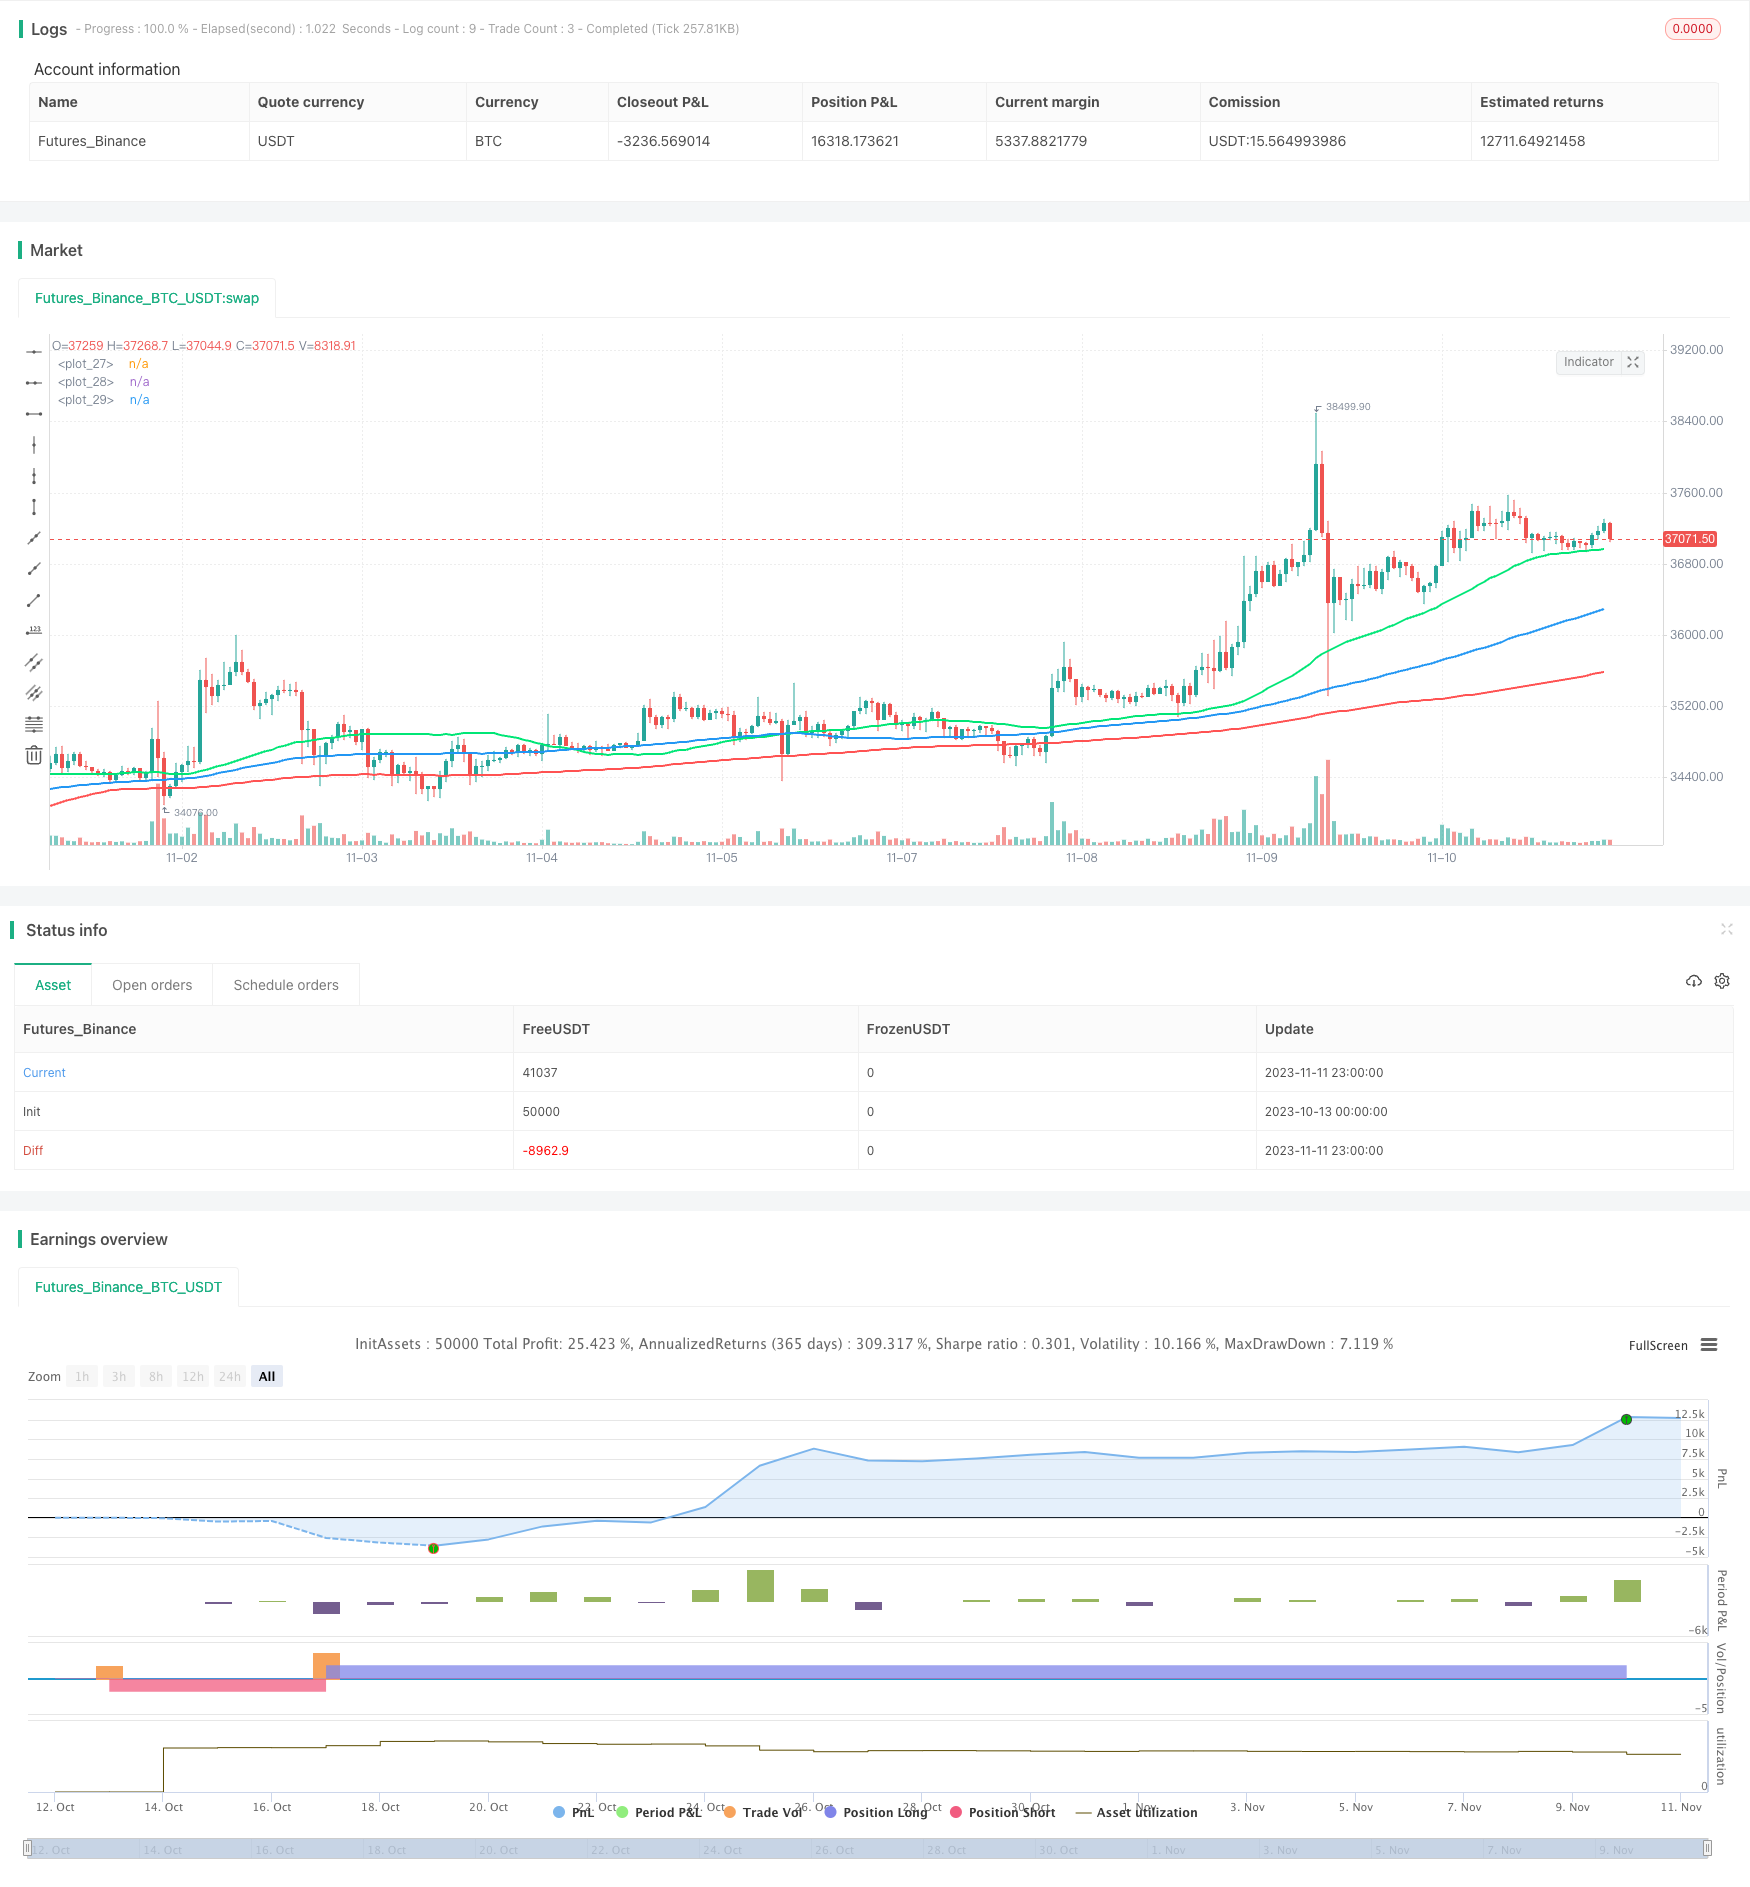
该策略还绘制了背景颜色来标识趋势方向,绿色代表上升趋势,红色代表下降趋势。
整体来说,该策略利用移动平均线的优势,以“鳄鱼口”形态判断趋势方向,并顺势入场,是一种较为典型的趋势跟踪策略。
优势分析
- 使用鳄鱼口判断,可以有效识别趋势方向。
- 采用不同周期线组合,可以提高形态判断的准确性。
- 顺势入场交易,符合趋势交易理论。
- 设置背景颜色辅助判断,直观可视。
- 交易逻辑简单清晰,容易实施。
风险分析
- 大周期震荡市场中,存在多次调整风险。
- 三线排列顺序改变时,平仓风险较大。
- 无法判断趋势强弱,存在不适合趋势入场的情况。
- 未考虑止损,大幅回撤风险较大。
- 固定周期无法适应市场变化,应采用自适应周期。
针对以上风险,可采取如下措施进一步优化:
增加趋势过滤条件,避免震荡市场频繁开仓。
优化出场条件,结合趋势指标判断平仓时机。
增加止损策略,控制单笔损失。
使用自适应移动平均线,使周期能动态调整。
优化方向
该策略可以从以下几个方面进行进一步优化:
增加趋势强弱判断,避免平稳或者震荡趋势过早入场。可以引入MACD,KDJ等辅助判断。
优化移动平均线周期参数,寻找最佳组合。可以通过回测多组参数找到最优参数。
利用自适应移动平均线,使周期能根据市场动能自适应变化。
增加止损策略,如跟踪止损、余额止损等,控制风险。
优化入场条件,可以考虑成交量,布林带等指标进行过滤,提高入场准确率。
优化出场条件,在三线交叉时结合趋势指标判断趋势反转概率,降低出场风险。
总结
威廉姆斯鳄鱼策略是一个典型的趋势跟踪策略。它通过快中慢三条移动平均线形成鳄鱼口判断趋势方向,并顺势入场。该策略优点是交易逻辑简单清晰,易于操作;缺点是对趋势判断准确性和风险控制能力较弱。未来可通过引入辅助指标、优化参数、止损等方式进行提升,使策略更适应复杂的市场环境。
/*backtest
start: 2023-10-13 00:00:00
end: 2023-11-12 00:00:00
period: 1h
basePeriod: 15m
exchanges: [{"eid":"Futures_Binance","currency":"BTC_USDT"}]
*/

//Noro
//2019

//@version=3
strategy(title = "Noro's Alligator Strategy by Bill Williams", shorttitle = "Alligator", overlay = true, default_qty_type = strategy.percent_of_equity, default_qty_value = 100, pyramiding = 0)

//Settings
needlong = input(true, defval = true, title = "Long")
needshort = input(true, defval = true, title = "Short")
capital = input(100, defval = 100, minval = 1, maxval = 10000, title = "Lot")
len1 = input(50, defval = 50, minval = 1, title = "MA 1 Length")
len2 = input(100, defval = 100, minval = 1, title = "MA 2 Length")
len3 = input(200, defval = 200, minval = 1, title = "MA 3 Length")
src = input(close, title = "Source")
showbg = input(false, title = "Show Background")
fromyear = input(1900, defval = 1900, minval = 1900, maxval = 2100, title = "From Year")
toyear = input(2100, defval = 2100, minval = 1900, maxval = 2100, title = "To Year")
frommonth = input(01, defval = 01, minval = 01, maxval = 12, title = "From Month")
tomonth = input(12, defval = 12, minval = 01, maxval = 12, title = "To Month")
fromday = input(01, defval = 01, minval = 01, maxval = 31, title = "From day")
today = input(31, defval = 31, minval = 01, maxval = 31, title = "To day")

//MAs
sma1 = sma(src, len1)
sma2 = sma(src, len2)
sma3 = sma(src, len3)
plot(sma1, color = lime, linewidth = 2)
plot(sma2, color = blue, linewidth = 2)
plot(sma3, color = red, linewidth = 2)

//Signals
up = sma1 > sma2 and sma2 > sma3
dn = sma1 < sma2 and sma2 < sma3

//Background
trend = 0
trend := up ? 1 : dn ? -1 : trend[1]
col = showbg == false ? na : trend == 1 ? lime : red
bgcolor(col)

//Trading
size = strategy.position_size
lot = 0.0
lot := size != size[1] ? strategy.equity / close * capital / 100 : lot[1]
if up
    strategy.entry("Long", strategy.long, needlong ? lot : 0, when = (time > timestamp(fromyear, frommonth, fromday, 00, 00) and time < timestamp(toyear, tomonth, today, 23, 59)))
if dn
    strategy.entry("Short", strategy.short, needshort ? lot : 0, when = (time > timestamp(fromyear, frommonth, fromday, 00, 00) and time < timestamp(toyear, tomonth, today, 23, 59)))

if time > timestamp(toyear, tomonth, today, 23, 59)
    strategy.close_all()