概述
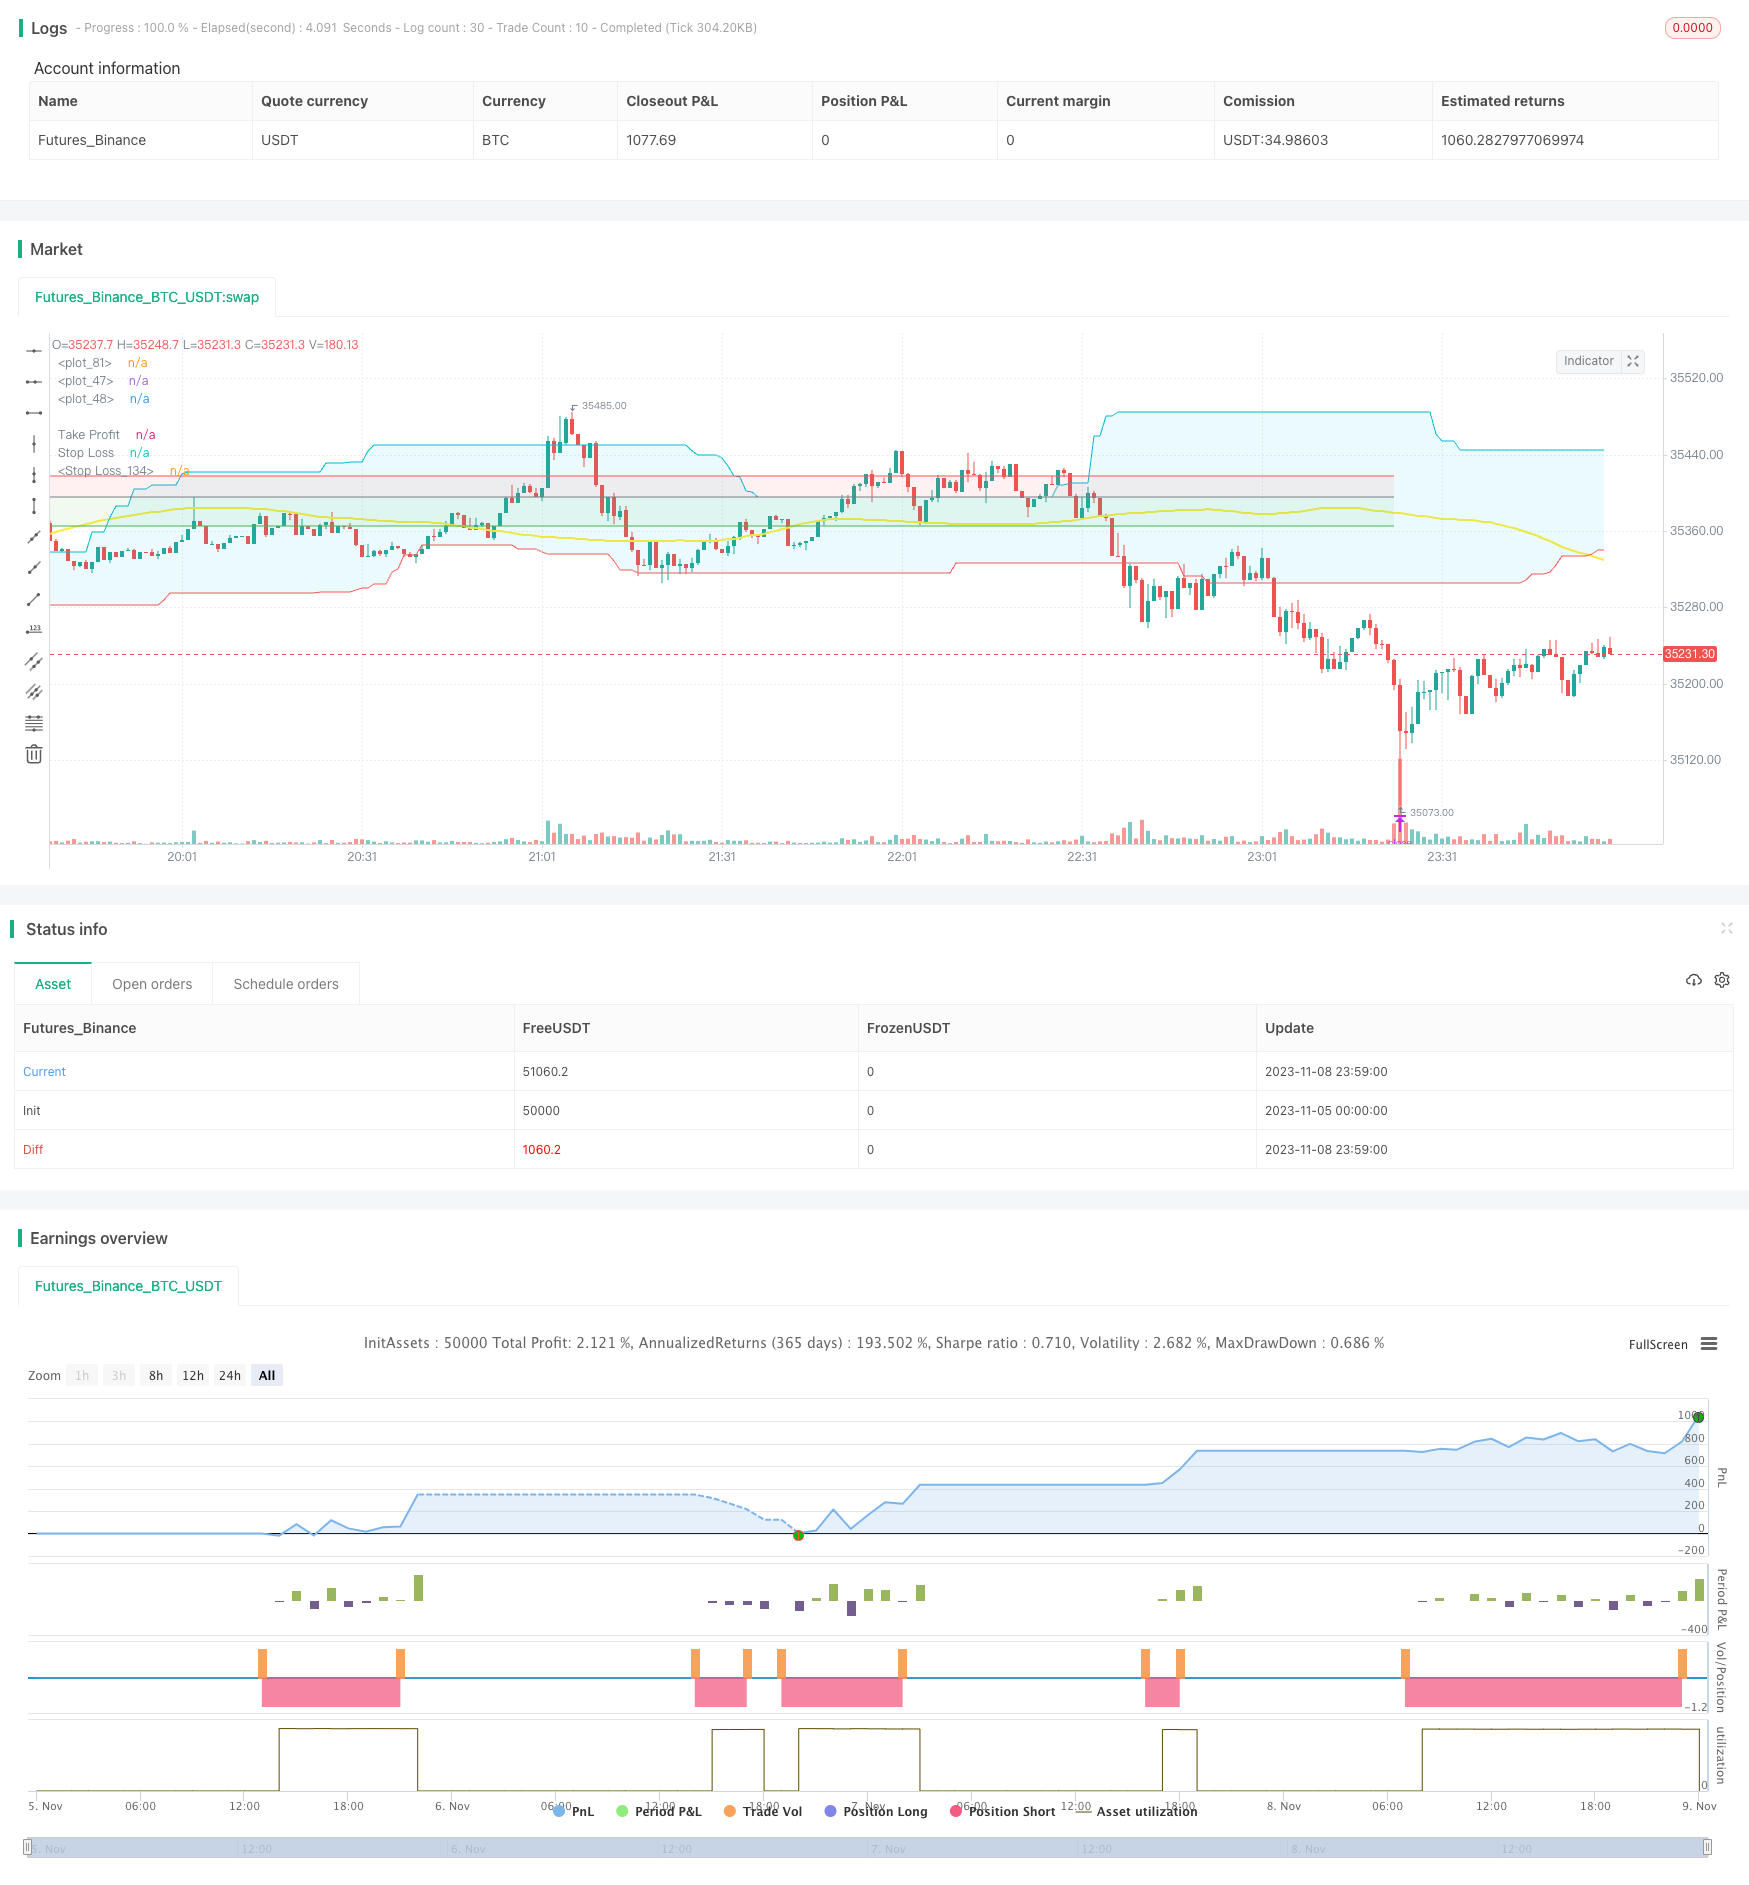
动量价格趋势跟踪策略运用多种动量指标来识别价格的趋势,在趋势开始阶段建立仓位,通过设置止盈止损来锁定盈利,实现对价格趋势的跟踪。
策略原理
动量价格趋势跟踪策略主要应用以下技术指标:
- ROC指标:该指标通过计算某一时间段价格变动速度的百分比,来判断价格动量。当ROC为正时,说明价格在上涨;当ROC为负时,说明价格在下跌。策略通过ROC指标判断价格趋势方向。
2.多空能量指标:该指标反映多头和空头力量对比关系。多空能量>0代表多头力量大于空头力量,价格上涨;反之价格下跌。策略利用该指标判断多空力量比较,预测价格方向。
3.背离指标:该指标通过计算价格与成交量背离情况,来判断趋势反转。策略利用背离信号作为入场时机。
4.Donchian通道:该指标通过价格最高价和最低价构建通道,通道边界可作为支持和阻力位。策略利用通道判断趋势方向。
5.移动平均线:该指标能滤掉价格supportedare忽高忽低的震荡,揭示主要趋势方向。策略利用其判断价格总体走势。
策略根据以上多个指标判断价格趋势和反转时机,在趋势开始阶段根据指标信号建立多头或空头仓位。然后根据止盈止损点来及时平仓锁定盈利,实现对价格趋势的捕捉。
优势分析
该策略具有以下优势:
应用多种指标 判断趋势,减少误判概率。
利用指标背离实现精准捕捉趋势反转点。
结合通道、移动均线判断大趋势方向。
设置止盈止损点,能够及时止盈,避免回撤扩大。
可根据参数调整,适用于不同周期和品种的交易。
策略逻辑清晰易理解,便于后期优化。
风险分析
该策略也存在一定的风险:
多指标组合判断增加了错误信号的概率,需要调整参数优化指标权重。
止损点设置过小可能增加止损概率,设置过大可能扩大回撤。需要综合考虑确定合理的止损点。
不同市场周期参数需要调整,盲目应用可能导致不适应市场环境。
需要足够的资金支持多单位同向交易,否则难以获取 excess returns。
程序交易存在回测过拟合风险,实盘效果存有一定的不确定性。
优化方向
该策略可以从以下几个方面进行优化:
优化指标参数,找到不同周期及品种的参数最优组合。
增加机器学习算法,自动寻找最优参数。
增加自适应止损机制,根据市场情况调整止损点。
结合高频因子和基本面指标,提高策略的 alpha。
开发自动测试框架,调整参数组合并验证交易效果。
引入风险管理模块,控制仓位规模,降低回撤。
增加模拟交易和实盘验证环节,提高策略的稳定性。
总结
本策略综合运用多种动量指标判断价格趋势,并设置止盈止损来锁定收益。该策略能够有效捕捉价格趋势,具有较强的稳定性。通过调整参数、优化结构以及风险控制,本策略可以进一步增强效果并降低交易风险。本策略为量化交易提供了一个可靠、易于操作的趋势跟踪方案。
/*backtest
start: 2023-11-05 00:00:00
end: 2023-11-09 00:00:00
period: 1m
basePeriod: 1m
exchanges: [{"eid":"Futures_Binance","currency":"BTC_USDT"}]
*/

// This source code is subject to the terms of the Mozilla Public License 2.0 at https://mozilla.org/MPL/2.0/
// © mbagheri746

//@version=4
strategy("Bagheri IG Ether v2", overlay=true, margin_long=100, margin_short=100)

TP = input(3000, minval = 1 , title ="Take Profit")
SL = input(2200, minval = 1 , title ="Stop Loss")


//_________________ RoC Definition _________________


rocLength = input(title="ROC Length", type=input.integer, minval=1, defval=186)
smoothingLength = input(title="Smoothing Length", type=input.integer, minval=1, defval=50)
src = input(title="Source", type=input.source, defval=close)

ma = ema(src, smoothingLength)
mom = change(ma, rocLength)

sroc = nz(ma[rocLength]) == 0
     ? 100
     : mom == 0
         ? 0
         : 100 * mom / ma[rocLength]

//srocColor = sroc >= 0 ? #0ebb23 : color.red
//plot(sroc, title="SROC", linewidth=2, color=srocColor, transp=0)
//hline(0, title="Zero Level", linestyle=hline.style_dotted, color=#989898)


//_________________ Donchian Channel _________________

length1 = input(53, minval=1, title="Upper Channel")
length2 = input(53, minval=1, title="Lower Channel")
offset_bar = input(91,minval=0, title ="Offset Bars")

upper = highest(length1)
lower = lowest(length2)

basis = avg(upper, lower)


DC_UP_Band = upper[offset_bar]
DC_LW_Band = lower[offset_bar]

l = plot(DC_LW_Band, style=plot.style_line, linewidth=1, color=color.red)
u = plot(DC_UP_Band, style=plot.style_line, linewidth=1, color=color.aqua)

fill(l,u,color = color.new(color.aqua,transp = 90))

//_________________ Bears Power _________________


wmaBP_period = input(65,minval=1,title="BearsP WMA Period")
line_wma = ema(close, wmaBP_period)

BP = low - line_wma


//_________________ Balance of Power _________________

ES_BoP=input(15, title="BoP Exponential Smoothing")
BOP=(close - open) / (high - low)

SBOP = rma(BOP, ES_BoP)

//_________________ Alligator _________________

//_________________ CCI _________________

//_________________ Moving Average _________________

sma_period = input(74, minval = 1 , title = "SMA Period")
sma_shift = input(37, minval = 1 , title = "SMA Shift")

sma_primary = sma(close,sma_period)

SMA_sh = sma_primary[sma_shift]

plot(SMA_sh, style=plot.style_line, linewidth=2, color=color.yellow)

//_________________ Long Entry Conditions _________________//

MA_Lcnd = SMA_sh > low and SMA_sh < high

ROC_Lcnd = sroc < 0

DC_Lcnd = open < DC_LW_Band

BP_Lcnd = BP[1] < BP[0] and BP[1] < BP[2]

BOP_Lcnd = SBOP[1] < SBOP[0]

//_________________ Short Entry Conditions _________________//

MA_Scnd = SMA_sh > low and SMA_sh < high

ROC_Scnd = sroc > 0

DC_Scnd = open > DC_UP_Band

BP_Scnd = BP[1] > BP[0] and BP[1] > BP[2]

BOP_Scnd = SBOP[1] > SBOP[0]

//_________________ OPEN POSITION __________________//

if strategy.position_size  == 0
    strategy.entry(id = "BUY", long = true , when = MA_Lcnd and ROC_Lcnd and DC_Lcnd and BP_Lcnd and BOP_Lcnd)
    strategy.entry(id = "SELL", long = false , when = MA_Scnd and ROC_Scnd and DC_Scnd and BP_Scnd and BOP_Scnd)

//_________________ CLOSE POSITION __________________//

strategy.exit(id = "CLOSE BUY", from_entry = "BUY", profit = TP , loss = SL)

strategy.exit(id = "CLOSE SELL", from_entry = "SELL" , profit = TP , loss = SL)

//_________________ TP and SL Plot __________________//

currentPL= strategy.openprofit
pos_price = strategy.position_avg_price
open_pos = strategy.position_size

TP_line = (strategy.position_size  > 0) ? (pos_price + TP/100) : strategy.position_size < 0 ? (pos_price - TP/100) : 0.0
SL_line = (strategy.position_size  > 0) ? (pos_price - SL/100) : strategy.position_size < 0 ? (pos_price + SL/100) : 0.0

// hline(TP_line, title = "Take Profit", color = color.green , linestyle = hline.style_dotted, editable = false)
// hline(SL_line, title = "Stop Loss", color = color.red , linestyle = hline.style_dotted, editable = false)


Tline = plot(TP_line != 0.0 ? TP_line : na , title="Take Profit", color=color.green, trackprice = true, show_last = 1)
Sline = plot(SL_line != 0.0 ? SL_line : na, title="Stop Loss", color=color.red, trackprice = true, show_last = 1)
Pline = plot(pos_price != 0.0 ? pos_price : na, title="Stop Loss", color=color.gray, trackprice = true, show_last = 1)


fill(Tline , Pline, color = color.new(color.green,transp = 90))
fill(Sline , Pline, color = color.new(color.red,transp = 90))

//_________________ Alert __________________//

//alertcondition(condition = , title = "Position Alerts", message = "Bagheri IG Ether\n Symbol: {{ticker}}\n Type: {{strategy.order.id}}")

//_________________ Label __________________//


inMyPrice           = input(title="My Price", type=input.float, defval=0)
inLabelStyle        = input(title="Label Style", options=["Upper Right", "Lower Right"], defval="Lower Right")

posColor = color.new(color.green, 25)
negColor = color.new(color.red, 25)
dftColor = color.new(color.aqua, 25)
posPnL   = (strategy.position_size != 0) ? (close * 100 / strategy.position_avg_price - 100) : 0.0
posDir   = (strategy.position_size  > 0) ? "long" : strategy.position_size < 0 ? "short" : "flat"
posCol   = (strategy.openprofit > 0) ? posColor : (strategy.openprofit < 0) ? negColor : dftColor
myPnL    = (inMyPrice != 0) ? (close * 100 / inMyPrice - 100) : 0.0

var label lb = na
label.delete(lb)
lb := label.new(bar_index, close,
   color=posCol,
   style=inLabelStyle=="Lower Right"?label.style_label_upper_left:label.style_label_lower_left,
   text=
      "╔═══════╗" +"\n" +
      "Pos: "  +posDir +"\n" +
      "Pos Price: "+tostring(strategy.position_avg_price) +"\n" +
      "Pos PnL: "  +tostring(posPnL, "0.00") + "%" +"\n" +
      "Profit: "  +tostring(strategy.openprofit, "0.00") + "$" +"\n" +
      "TP: "  +tostring(TP_line, "0.00") +"\n" +
      "SL: "  +tostring(SL_line, "0.00") +"\n" +
      "╚═══════╝")