EMA Percentage Channel with Bollinger Band Range Trading Strategy

Overview
This strategy is based on the user's selection of an EMA and defined percentage channel. It goes long when the price is below the upper band and goes short when the price is above the lower band. If the price starts trending and moves outside the channel, all positions are closed to prevent loss.
For trending markets, the sister "EMA Percentage Channel with Bollinger Band Trend Trading Strategy" should be used instead.
Principles
-
Calculate the 200-period EMA as the baseline EMA.
-
Calculate the upper and lower bands based on the user-defined percentage:
Upper Band = EMA * (1 + Percentage)
Lower Band = EMA * (1 - Percentage) -
Calculate the 20-period Bollinger Bands to depict the channel range.
-
Go long when the closing price crosses above the lower Bollinger Band from below. Go short when the closing price crosses below the upper Bollinger Band from above.
-
Use ATR to calculate the stop loss to avoid excessive losses.
-
If the price moves outside the defined percentage channel range, close all positions to prevent further losses.
Advantages
-
The EMA baseline helps better capture trend reversal points.
-
The percentage channel sets a reasonable trading range to avoid overtrading.
-
The Bollinger Bands provide support and resistance levels to aid entry timing.
-
The ATR trailing stop dynamically sets stop loss to effectively control per trade risk.
-
Closing all positions when the price breaches the channel quickly controls losses.
-
The customizable parameters are flexible for different market conditions.
Risks
-
A channel range that is too wide may miss trends or delay stopping losses.
-
A channel range that is too narrow may cause overtrading and increase transaction costs.
-
Poor Bollinger Bands parameter settings may cause missed trading opportunities.
-
A stop loss threshold set too loosely can lead to excessive losses per trade.
-
Parameters need to be optimized to find the optimal trading range.
Optimization Directions
-
Test different EMA periods to find the most suitable moving average.
-
Optimize the percentage channel parameters to determine the optimal channel range.
-
Adjust the Bollinger Bands period to better capture volatility.
-
Tune the ATR period and multiplier to further refine the stop loss strategy.
-
Test long-only above EMA or short-only below EMA conditions and see if it improves win rate.
-
Incorporate trend indicators to determine if early exit is needed.
Conclusion
This strategy combines the strengths of moving averages, channels, volatility and more to create a relatively stable range trading system. The key is finding the most suitable parameter settings for each specific market to balance risk and reward. Future improvements can continue optimizing rules and parameters, or combining with trend strategies.
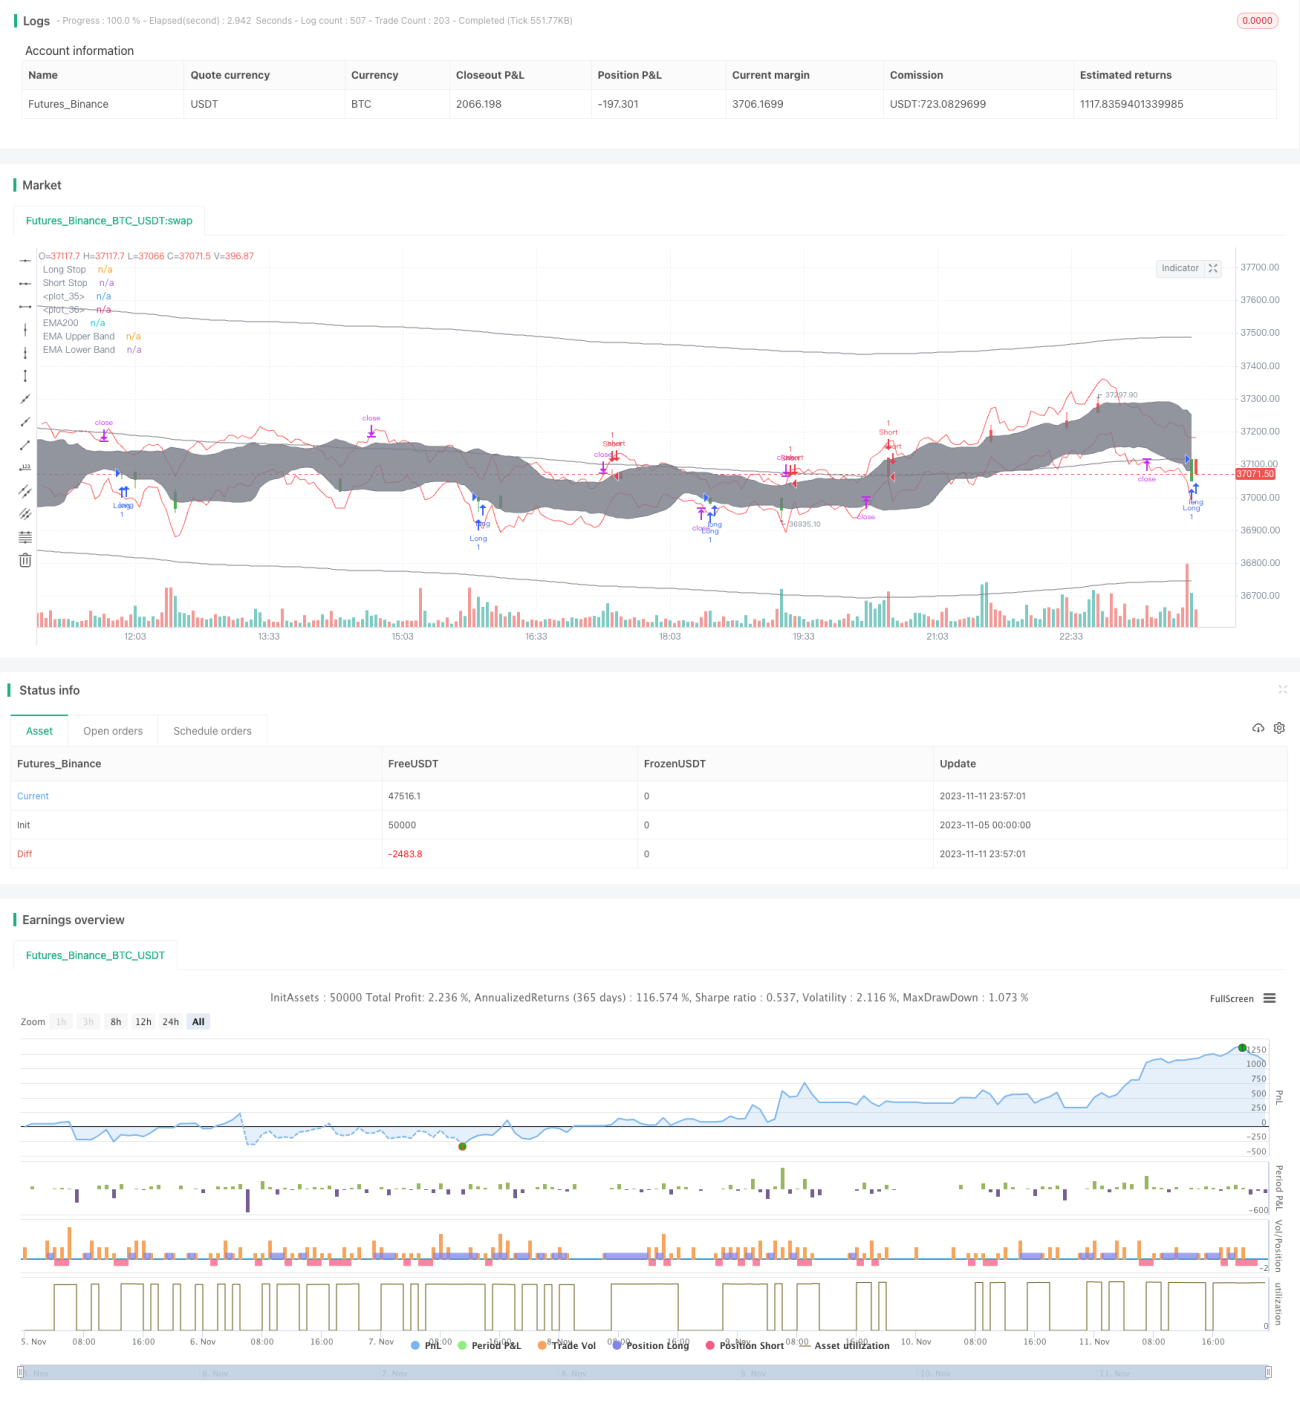
/*backtest
start: 2023-11-05 00:00:00
end: 2023-11-12 00:00:00
period: 3m
basePeriod: 1m
exchanges: [{"eid":"Futures_Binance","currency":"BTC_USDT"}]
*/

//@version=4
strategy(title="[mdeacey] EMA% Channel + BB Range Strategy", shorttitle="[mdeacey] EMA% Channel + BB Range Strategy", overlay=true)

//EMA 200- 1