Inverse MACD Momentum Entangled with DMI Breakout Short-Term Scalping Strategy

Author: ChaoZhang, Date: 2023-11-13 17:42:23
Tags:

img

Overview

This strategy focuses on shorting during bear market conditions by utilizing two strength-based indicators to provide confluence that the start of a short-term downtrend has occurred - catching the shorting opportunity as soon as possible.

The strategy works well on coins you plan to hodl long-term and performs especially well whilst using an automated trading bot that can execute trades for you. It allows you to hedge your investment by allocating a percentage of your coins to trade with, without risking your entire holding. This mitigates unrealized losses from hodling as it provides additional cash from the profits made. You can then choose to hodl this cash, or use it to reinvest when the market reaches attractive buying levels.

Alternatively, you can use this when trading contracts on futures markets where there is no need to already own the underlying asset prior to shorting it.

Strategy Logic

The trading system uses the Momentum Average Convergence Divergence (MACD) indicator and the Directional Movement Index (DMI) indicator to confirm when the best time is for selling. Combining these two indicators prevents trading during uptrends and reduces the likelihood of getting stuck in a market with low volatility.

The MACD is a trend following momentum indicator and provides identification of short-term trend direction. In this variation it utilizes the 12-period as the fast and 26-period as the slow length EMAs, with signal smoothing set at 9.

The DMI indicates what way price is trending and compares prior lows and highs with two lines drawn between each - the positive directional movement line (+DI) and the negative directional movement line (-DI). The trend can be interpreted by comparing the two lines and what line is greater. When the negative DMI is greater than the positive DMI, there are more chances that the asset is trading in a sustained downtrend, and vice versa.

The system will enter trades when two conditions are met:

  1. The MACD histogram turns bearish.

  2. When the negative DMI is greater than the positive DMI.

The strategy comes with a fixed take profit combined with a volatility stop, which acts as a trailing stop to adapt to the trend’s strength. Depending on your long-term confidence in the asset, you can edit the fixed take profit to be more conservative or aggressive.

The position is closed when:

Take-Profit Exit: +8% price decrease from entry price.

OR

Stop-Loss Exit: Price crosses above the volatility stop.

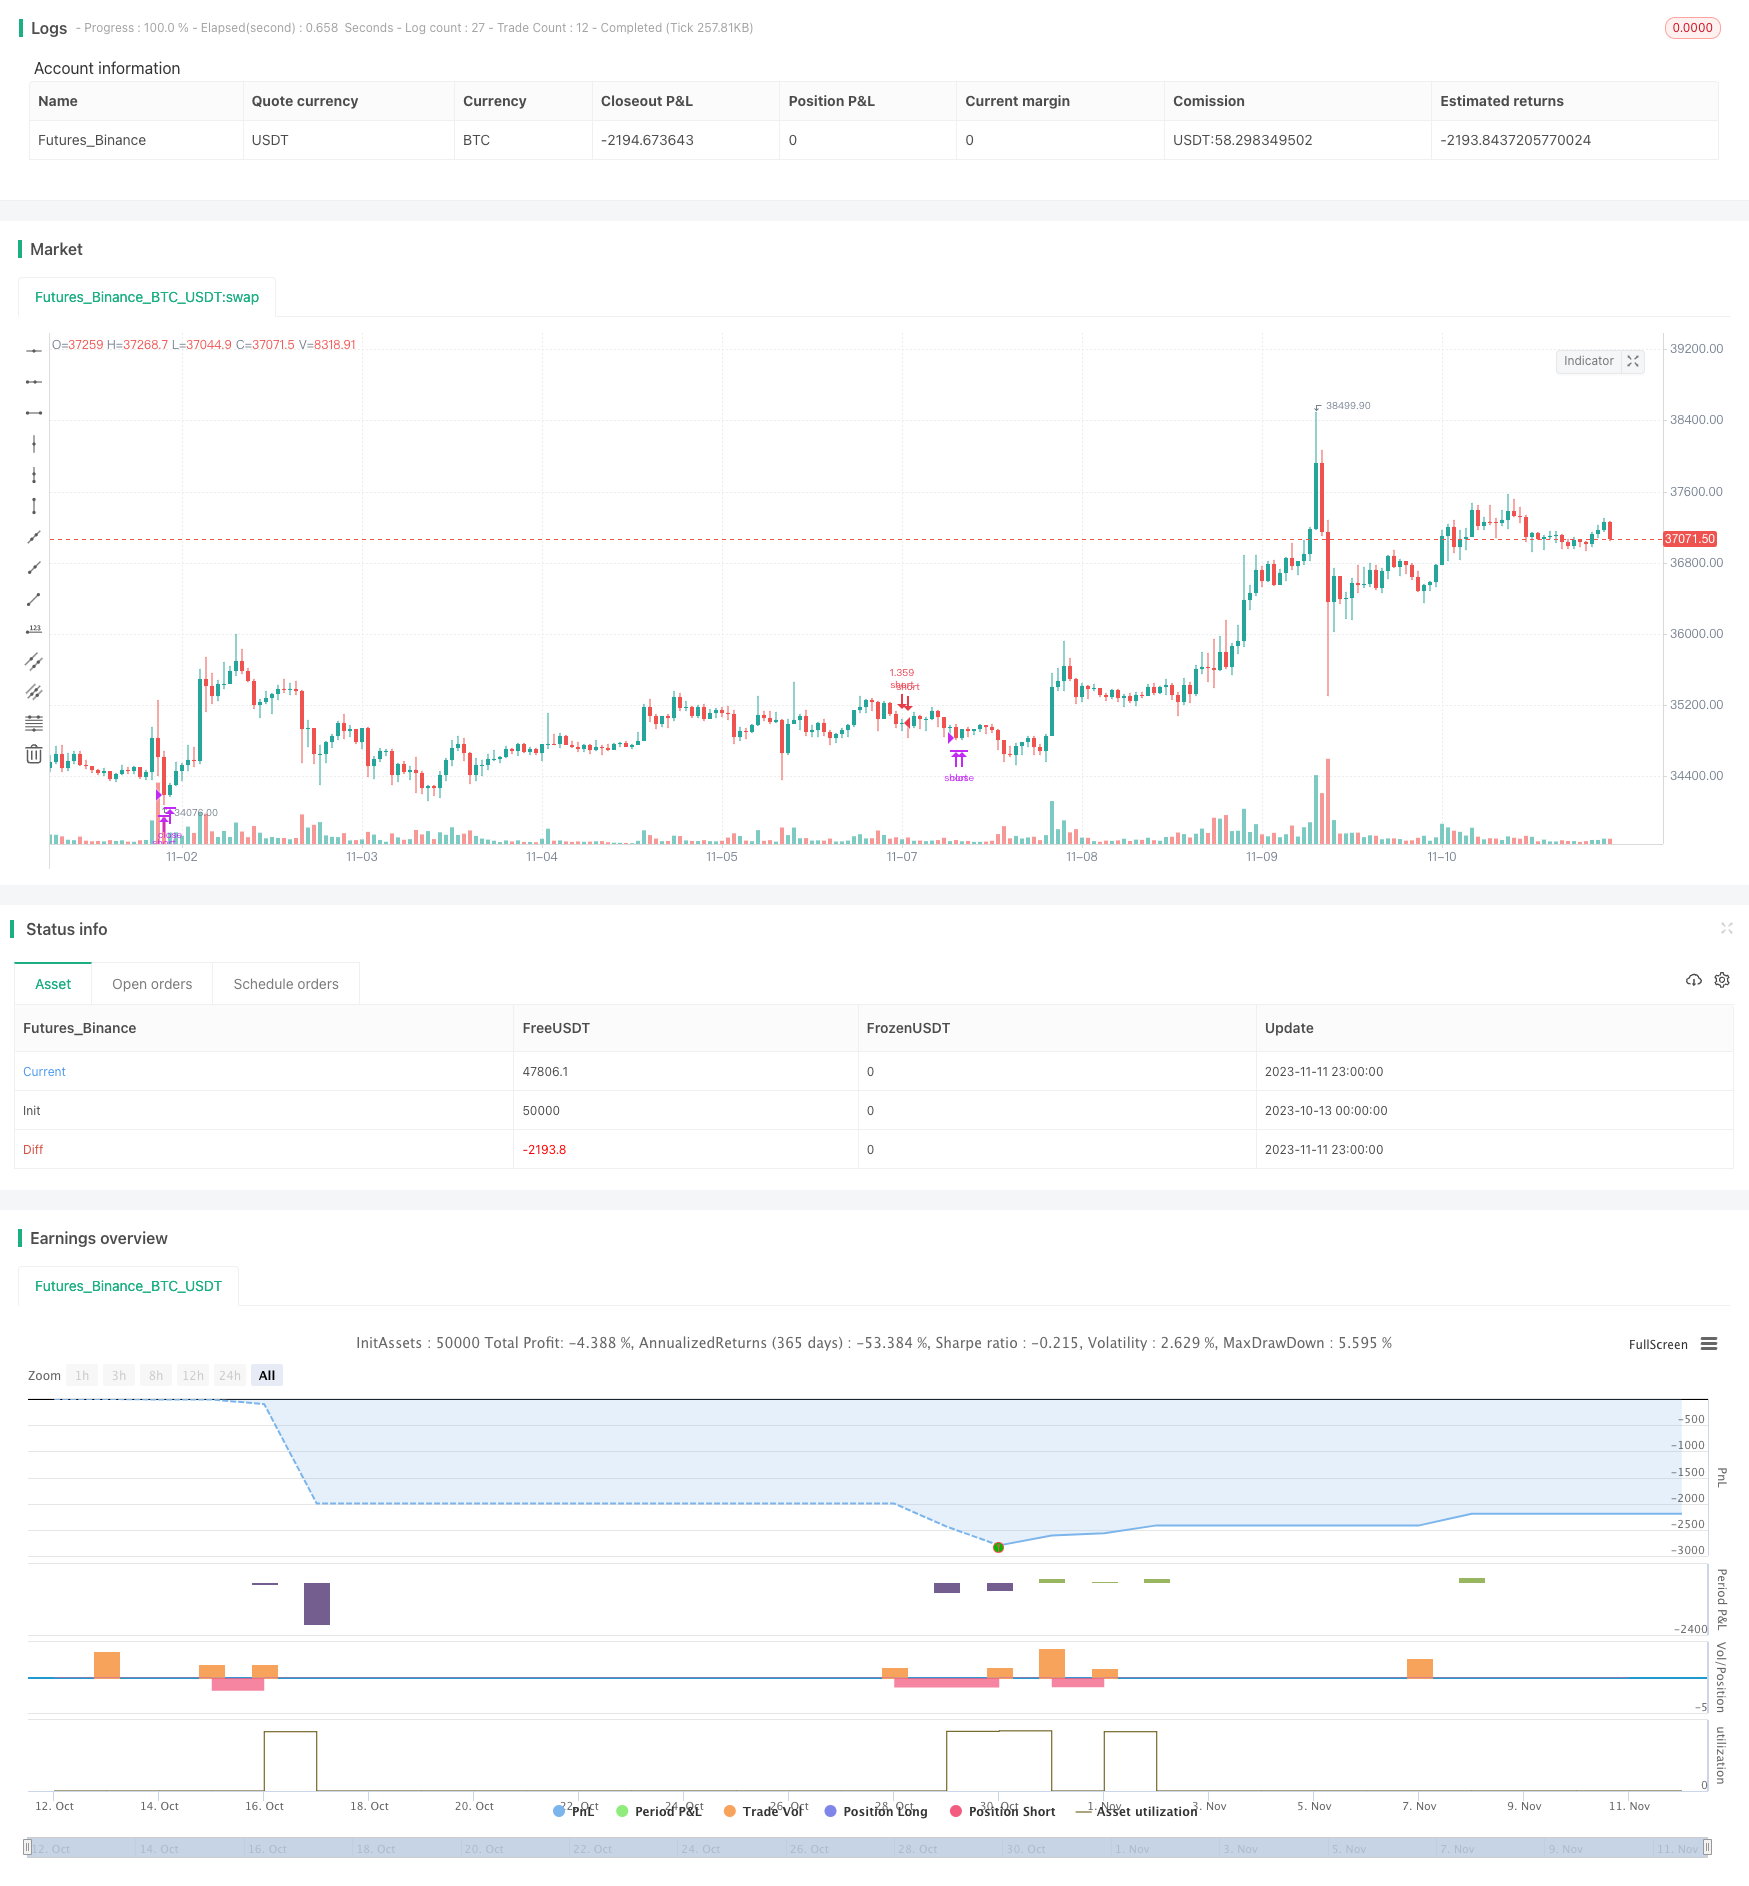
In general, this approach suits medium to long term strategies. The backtesting for this strategy begins on 1 April 2022 to 18 July 2022 in order to demonstrate its results in a bear market. Back testing it further from the beginning of 2022 onwards further also produces good returns.

Pairs that produce very strong results include SOLUSDT on the 45m timeframe, MATICUSDT on the 2h timeframe, and AVAUSDT on the 1h timeframe. Generally, the back testing suggests that it works best on the 45m/1h timeframe across most pairs.

A trading fee of 0.1% is also taken into account and is aligned to the base fee applied on Binance.

Advantage Analysis

The advantages of this strategy include:

  • Utilizes the strengths of both MACD and DMI indicators to improve the accuracy of entry signals and avoid false breakouts.

  • Employs a combination of fixed take profit and volatility trailing stop exit mechanisms to ensure higher take profits while controlling risk.

  • Suitable for bear market downtrends to capture substantial short-term scalping profits.

  • Can be used to hedge long positions to gain additional income. Or directly short futures contracts for scalping.

  • Strong backtest results, especially on 1h and 45m timeframes suitable for high frequency trading.

Risk Analysis

The risks of this strategy include:

  • DMI and MACD as lagging indicators have a higher probability of generating erroneous signals around trend turning points, requiring stop loss monitoring.

  • Improper fixed take profit settings may result in take profits being too small or too large. Adjustments based on different coin volatility is recommended.

  • Volatility trailing stops can be broken during periods of violent swings, requiring combination with additional stop loss.

  • Improper backtest time period selection may lead to overly optimistic results. Longer testing across different market conditions should be done.

  • Real-world performance will be impacted by trading fees, market order slippage etc leading to deviations from backtest.

Optimization Directions

This strategy can be further optimized in the following aspects:

  • Utilize machine learning to auto optimize MACD and DMI parameter combinations, adapted to different timeframes and coins.

  • Add volatility based dynamic take profits, adjusting take profit range based on market volatility.

  • Incorporate additional indicators, forming a multi-factor model to improve filtering. Such as BVN and OBV.

  • Add machine learning models to aid MACD and DMI in signaling.

  • Use limit orders instead of market orders to reduce slippage impact.

  • Test on individual coins to find optimal timeframe parameters.

Conclusion

In summary, this short-term bear scalping strategy provides substantial quantitative profits by identifying optimal shorting moments through the powerful MACD and DMI combination. It can be used to hedge long positions and directly short futures contracts. Optimizing stops and tuning parameters can further improve win rate. The strategy merits active application and optimization by bear market traders.


/*backtest
start: 2023-10-13 00:00:00
end: 2023-11-12 00:00:00
period: 1h
basePeriod: 15m
exchanges: [{"eid":"Futures_Binance","currency":"BTC_USDT"}]
*/

//@version=5
strategy("Inverse MACD + DMI Scalping with Volatility Stop (Shorting) (By Coinrule)",

         overlay=true,
         initial_capital=10000,
         process_orders_on_close=true,
         default_qty_type=strategy.percent_of_equity,
         default_qty_value=100,
         commission_type=strategy.commission.percent,
         commission_value=0.1)

showDate = input(defval=true, title='Show Date Range')
timePeriod = time >= timestamp(syminfo.timezone, 2022, 4, 1, 0, 0)
notInTrade = strategy.position_size <= 0

// DMI and MACD inputs and calculations
[pos_dm, neg_dm, avg_dm] = ta.dmi(14, 14)
[macd, macd_signal, macd_histogram] = ta.macd(close, 12, 26, 9)

Take_profit = input(3) / 100
longTakeProfit = strategy.position_avg_price * (1 + Take_profit)

length = input.int(20, 'Length', minval=2)
src = input(close, 'Source')
factor = input.float(2.0, 'vStop Multiplier', minval=0.25, step=0.25)
volStop(src, atrlen, atrfactor) =>
    var max = src
    var min = src
    var uptrend = true
    var stop = 0.0
    atrM = nz(ta.atr(atrlen) * atrfactor, ta.tr)
    max := math.max(max, src)
    min := math.min(min, src)
    stop := nz(uptrend ? math.max(stop, max - atrM) : math.min(stop, min + atrM), src)
    uptrend := src - stop >= 0.0
    if uptrend != nz(uptrend[1], true)
        max := src
        min := src
        stop := uptrend ? max - atrM : min + atrM
        stop
    [stop, uptrend]
    
[vStop, uptrend] = volStop(src, length, factor)

closeShort = close > longTakeProfit or ta.crossunder(close, vStop)

//Entry
strategy.entry(id='short', direction=strategy.short, when=ta.crossover(macd_signal, macd) and pos_dm < neg_dm and timePeriod)

//Exit
strategy.close('short', when=closeShort and timePeriod)


More