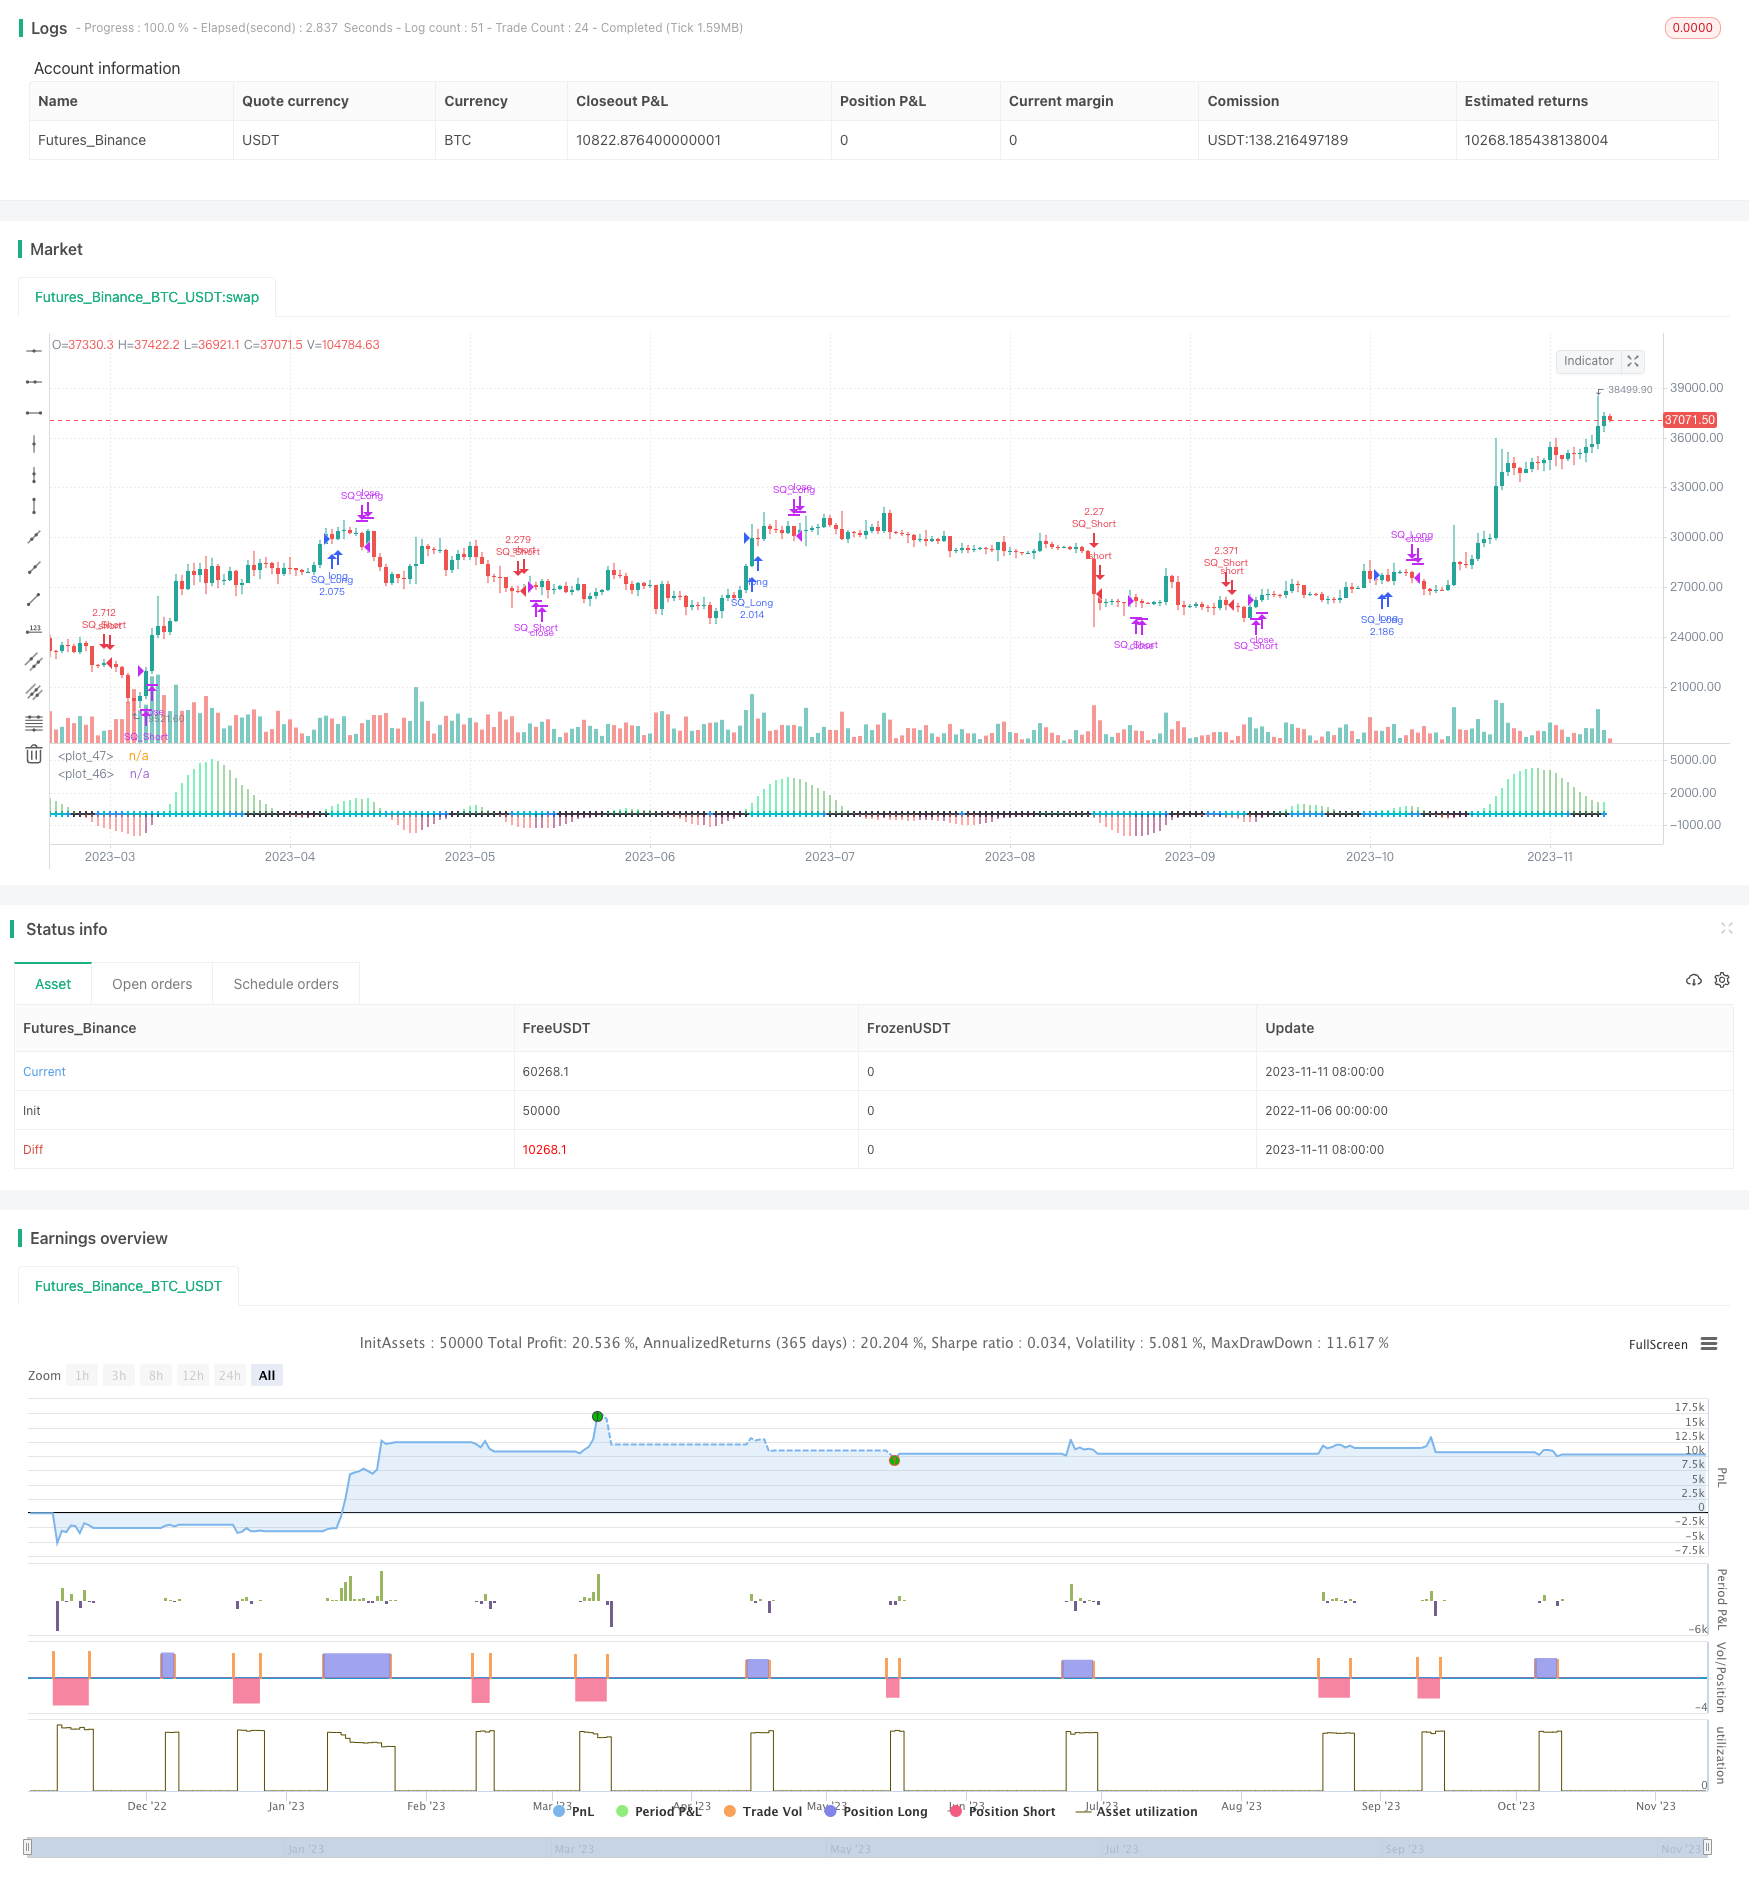
概述
该策略基于LazyBear的压缩动量指标,结合布林带和Keltner通道,识别价格突破通道形成的压缩和扩张形态,判断股票价格的潜在趋势方向,采用趋势跟踪方式来决定开仓方向。策略优点是充分利用了动量指标识别潜在趋势的能力,并设置了多个条件过滤器来控制交易信号的质量,可以有效过滤掉不确定的交易信号,避免在震荡盘整中过于频繁交易。
策略原理
计算布林带中的中轨、上轨和下轨。中轨为n日收盘价的简单移动平均线,上下轨为中轨加减m倍的n日收盘价标准差。
计算Keltner通道中的中线、上线和下线。中线为n日收盘价的简单移动平均线,上下线为中线加减m倍的n日真实波幅的简单移动平均。
判断价格是否突破布林带和Keltner通道的上下轨构成压缩和扩张形态。当价格从上方突破下轨时为压缩形态,当价格从下方突破上轨时为扩张形态。
计算线性回归曲线的数值,作为动量指标。当动量线上穿0时为买入信号,下穿0时为卖出信号。
结合压缩扩张形态、动量指标方向、均值过滤器等多重条件判断最终交易信号。只有满足所有条件才会生成交易信号,避免错误交易。
策略优势
使用布林带和Keltner通道双重过滤,识别高质量的压缩和扩张形态。
动量指标能够及时捕捉价格趋势反转,与通道指标形成互补。
允许超前入场,提高盈利机会。
采用多重条件判断,避免在震荡行情中频繁开仓。
各技术指标参数可自定义,适应不同品种和参数组合。
可设定回测时间段,针对特定时间周期进行优化测试。
策略风险
趋势跟踪策略,当趋势发生反转时容易产生亏损。
参数设置不当可能导致交易频率过高或信号质量不佳。
依赖历史数据测试,无法保证未来返回持续稳定。
无法应对突发事件引起的市场震荡和价格剧烈波动。
回测时间窗口设置不当,可能导致过拟合。
策略优化方向
优化布林带和Keltner通道的参数,找到最佳组合。
测试加入移动止损来控制单笔交易最大亏损。
尝试在特定品种、周期参数组合下进一步优化。
探索加入机器学习模型判断趋势反转。
测试不同入场顺序和仓位管理策略。
研究如何识别趋势反转信号并及时止损。
总结
该策略融合多种技术指标判断价格趋势方向并进行趋势跟踪,具有较强的适应性。通过参数自定义和多重条件过滤,可以有效控制交易频率和提高信号质量。但反转交易和突发事件仍需警惕,可以继续探索趋势反转信号和风险控制机制进行优化,使策略更稳健。
/*backtest
start: 2022-11-06 00:00:00
end: 2023-11-12 00:00:00
period: 1d
basePeriod: 1h
exchanges: [{"eid":"Futures_Binance","currency":"BTC_USDT"}]
*/

//@version=3
//Strategy based on LazyBear Squeeze Momentum Indicator
//I added some custom feature and filters
//
// @author LazyBear
// List of all my indicators:
// https://docs.google.com/document/d/15AGCufJZ8CIUvwFJ9W-IKns88gkWOKBCvByMEvm5MLo/edit?usp=sharing
// v2 - fixed a typo, where BB multipler was always stuck at 1.5. [Thanks @ucsgears]
//
strategy(shorttitle = "SQZMOM_LB", title="Strategy for Squeeze Momentum Indicator [LazyBear]", overlay=false, calc_on_every_tick=true, pyramiding=0,default_qty_type=strategy.percent_of_equity,default_qty_value=100,currency=currency.USD)

length = input(14, title="BB Length")
mult = input(2.0,title="BB MultFactor")
lengthKC=input(16, title="KC Length")
multKC = input(1.5, title="KC MultFactor")

useTrueRange = input(true, title="Use TrueRange (KC)", type=bool)

//FILTERS
useExtremeOrders  = input(false, title="Early entry on momentum change", type=bool)
useMomAverage = input(false, title="Filter for Momenutum value", type=bool)
MomentumMin = input(20, title="Min for momentum")

// Calculate BB
src = close
basis = sma(src, length)
dev = mult * stdev(src, length)
upperBB = basis + dev
lowerBB = basis - dev

// Calculate KC
ma = sma(src, lengthKC)
range = useTrueRange ? tr : (high - low)
rangema = sma(range, lengthKC)
upperKC = ma + rangema * multKC
lowerKC = ma - rangema * multKC

sqzOn  = (lowerBB > lowerKC) and (upperBB < upperKC)
sqzOff = (lowerBB < lowerKC) and (upperBB > upperKC)
noSqz  = (sqzOn == false) and (sqzOff == false)

val = linreg(src  -  avg(avg(highest(high, lengthKC), lowest(low, lengthKC)),sma(close,lengthKC)), lengthKC,0)

bcolor = iff( val > 0,            iff( val > nz(val[1]), lime, green),            iff( val < nz(val[1]), red, maroon))
scolor = noSqz ? blue : sqzOn ? black : aqua
plot(val, color=bcolor, style=histogram, linewidth=4)
plot(0, color=scolor, style=cross, linewidth=2)

//LOGIC
//momentum filter
filterMom=useMomAverage?abs(val)>(MomentumMin/100000)?true:false:true

//standard condition
longCondition = scolor[1]!=aqua and scolor==aqua and bcolor==lime and filterMom
exitLongCondition = bcolor==green and not useExtremeOrders
shortCondition = scolor[1]!=aqua and scolor==aqua and bcolor==red and filterMom
exitShortCondition = bcolor==maroon and not useExtremeOrders

//early entry
extremeLong= useExtremeOrders and scolor==aqua and bcolor==maroon and bcolor[1]!=bcolor[0] and filterMom
exitExtLong = scolor==black or bcolor==red
extremeShort = useExtremeOrders and scolor==aqua and bcolor==green and bcolor[1]!=bcolor[0] and filterMom
exitExtShort = scolor==black or bcolor==lime

//STRATEGY

strategy.entry("SQ_Long", strategy.long, when = longCondition)
strategy.close("SQ_Long",when = exitLongCondition )

strategy.entry("SQ_Long_Ext", strategy.long, when = extremeLong)
strategy.close("SQ_Long_Ext",when = exitExtLong)
//strategy.exit("exit Long", "SQ_Long", when = exitLongCondition)

strategy.entry("SQ_Short", strategy.short, when = shortCondition)
strategy.close("SQ_Short",when = exitShortCondition)

strategy.entry("SQ_Short_Ext", strategy.short, when = extremeShort)
strategy.close("SQ_Short_Ext",when = exitExtShort)
//strategy.exit("exit Short", "SQ_Short", when = exitShortCondition)


// // === Backtesting Dates === thanks to Trost

// testPeriodSwitch = input(true, "Custom Backtesting Dates")
// testStartYear = input(2018, "Backtest Start Year")
// testStartMonth = input(1, "Backtest Start Month")
// testStartDay = input(1, "Backtest Start Day")
// testStartHour = input(0, "Backtest Start Hour")
// testPeriodStart = timestamp(testStartYear,testStartMonth,testStartDay,testStartHour,0)
// testStopYear = input(2018, "Backtest Stop Year")
// testStopMonth = input(12, "Backtest Stop Month")
// testStopDay = input(14, "Backtest Stop Day")
// testStopHour = input(23, "Backtest Stop Hour")
// testPeriodStop = timestamp(testStopYear,testStopMonth,testStopDay,testStopHour,0)
// testPeriod() =>
//     time >= testPeriodStart and time <= testPeriodStop ? true : false
// isPeriod = testPeriodSwitch == true ? testPeriod() : true
// // === /END

// if not isPeriod
//     strategy.cancel_all()
//     strategy.close_all()