概述
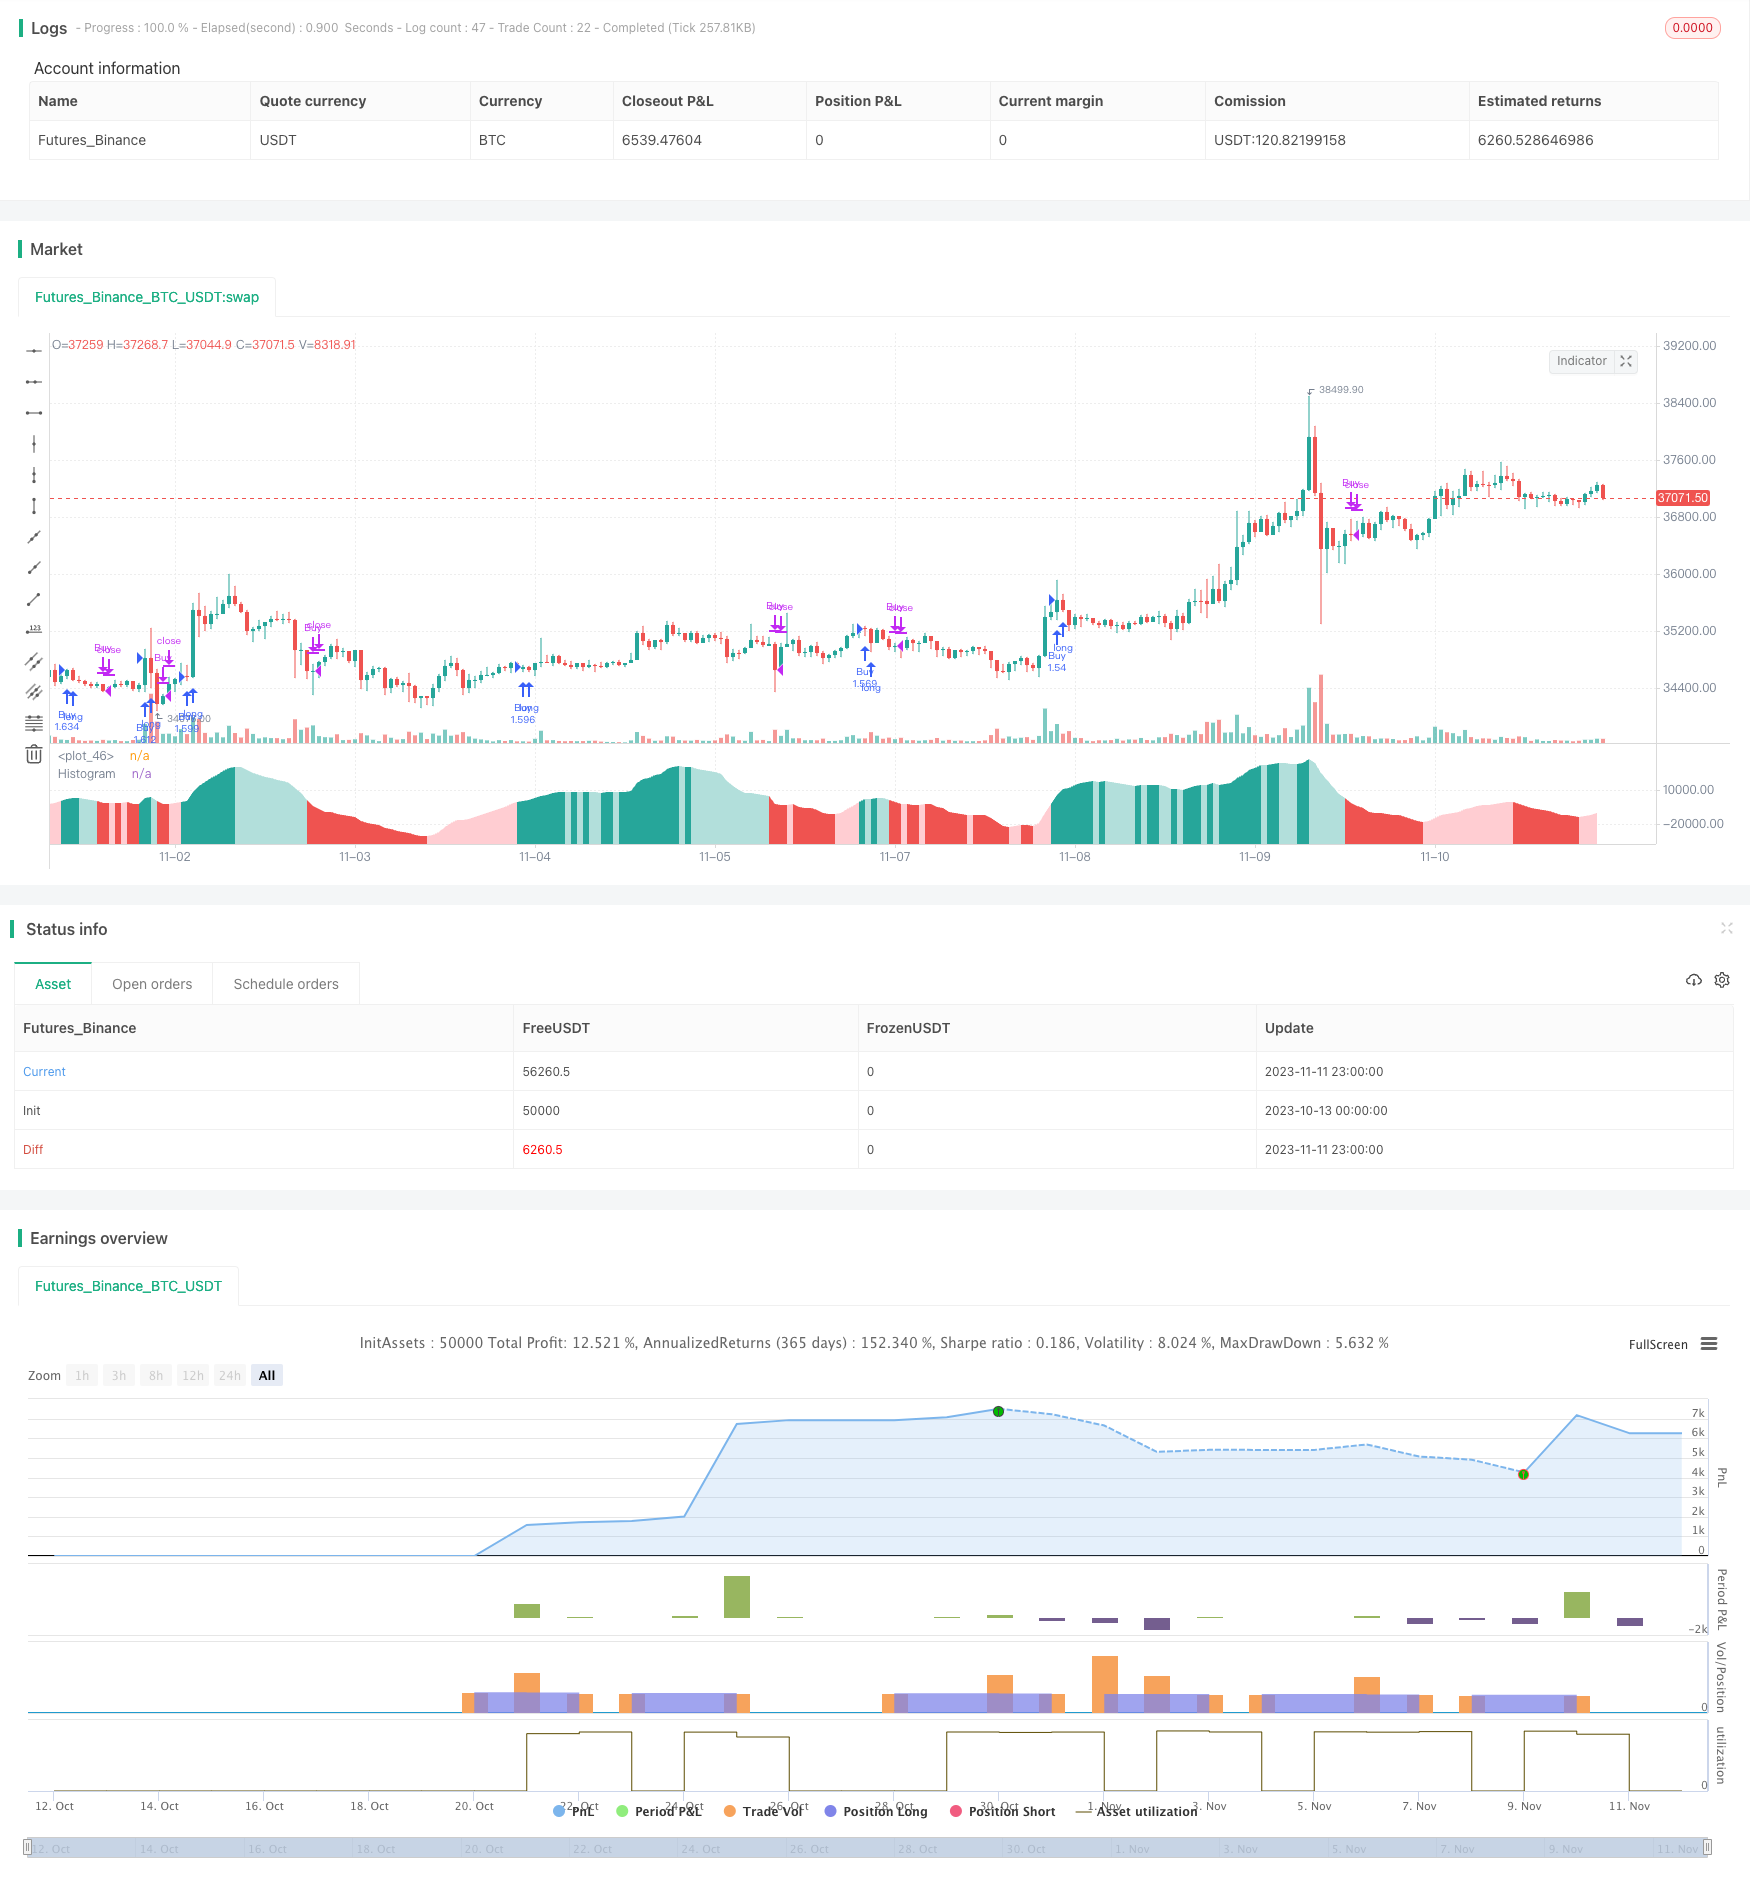
本策略通过比较价格变动和交易量,揭示市场参与者的情绪,以MACD的形式呈现并发出交易信号。
策略原理
该策略主要通过以下几种计算方法揭示市场情绪:
每根K线的价格变动除以交易量。这可以直接看出买卖力量的强弱。
对价格变动和交易量分别应用指数平滑移动平均线,再将价格变动的EMA除以交易量的EMA。这样可以过滤掉部分噪音,得到较为平滑的“市场情绪”曲线。
在“市场情绪”上再计算快慢EMA,得到类似MACD的曲线。其中MACD线显示动量方向和强度,信号线是其移动平均,柱状图显示两条曲线的差值,代表动量变化。
当柱状图上穿0时为多头市场情绪增强的信号,下穿0时为空头市场情绪增强的信号。也可以观察柱状图的背离现象。
优势分析
本策略具有以下优势:
利用成交量信息判断市场参与者情绪,更有说服力。
MACD形式直观,使用简便。
参数可调,适用于不同品种和周期。
可检测柱状图背离,发现潜在趋势转折点。
代码结构清晰,容易理解和优化。
风险分析
本策略也存在以下风险:
成交量能反映市场情绪,但不能保证交易信号正确。需结合价格行情判断。
MACD参数设置不当可能导致错失信号或产生假信号。需针对品种和周期优化参数。
背离信号可能是假信号,无法确定趋势转折,需谨慎看待。
存在晚期入场被套的风险。可适当等待追踪止损,或与趋势和相关品种合理验证。
优化方向
本策略可从以下方面进行优化:
testing不同品种和周期的参数组合,寻找最优参数。
加入止损策略,降低亏损风险。
与相关品种价格趋势进行组合,验证交易信号。
利用机器学习方法动态优化参数。
增加过滤条件,减少假信号。例如大级别趋势、波动率等。
总结
本策略利用价格变动与交易量比值判断市场情绪,以MACD形式产生交易信号。相比仅看价格信息,考量交易量能更准确判断多空力量对比和市场热度。可根据不同品种和周期优化参数,且有进一步优化空间。总体来说,本策略思路新颖,使用简便,有效把握市场热点,值得进一步开发。
/*backtest
start: 2023-10-13 00:00:00
end: 2023-11-12 00:00:00
period: 1h
basePeriod: 15m
exchanges: [{"eid":"Futures_Binance","currency":"BTC_USDT"}]
*/

// This source code is subject to the terms of the Mozilla Public License 2.0 at https://mozilla.org/MPL/2.0/
// © dannylimardi

//@version=4
strategy("Sentiment Oscillator", "Sentiment", overlay=false, initial_capital=100, default_qty_type=strategy.percent_of_equity, default_qty_value=100, commission_type=strategy.commission.percent, commission_value=0.08)


//Inputs
msLen = input(49, type=input.integer, title="Market Sentiment Lookback Length")
emaLen1 = input(40, type=input.integer, title="Fast EMA Length")
emaLen2 = input(204, type=input.integer, title="Slow EMA Length")
signalLen = input(20, type=input.integer, title="Signal Length")
showMs = input(false, type=input.bool, title="Show Market Sentiment?")
showHist = input(true, type=input.bool, title="Show Momentum?")
showMacd = input(false, type=input.bool, title="Show MACD Line?")
showSignal = input(false, type=input.bool, title="Show Signal Line?")
showCpv = input(false, type=input.bool, title="(Show Change/Volume for Each Bar?)")
showEma1 = input(false, type=input.bool, title="(Show Fast EMA?)")
showEma2 = input(false, type=input.bool, title="(Show Slow EMA?)")

//Calculations
priceChange = close - close[1]
changePerVolume = (priceChange/volume) * 10000000  // (The 1000000 doesn't have any significance, it's just to avoid color-change errors when the values are too emall.)
priceChangeEma = ema(priceChange, msLen)
volumeEma = ema(volume, msLen)
marketSentiment = priceChangeEma/volumeEma * 100000000
msEma1 = ema(marketSentiment, emaLen1)
msEma2 = ema(marketSentiment, emaLen2)
macd = msEma1-msEma2
signal = ema(macd, signalLen)
hist = macd-signal

//Plot colors
col_grow_above = #26A69A
col_grow_below = #FFCDD2
col_fall_above = #B2DFDB
col_fall_below = #EF5350
col_macd = #0094ff
col_signal = #ff6a00

//Drawings
plot(showHist ? hist : na, title="Histogram", style=plot.style_area, color=(hist>=0 ? (hist[1] < hist ? col_grow_above : col_fall_above) : (hist[1] < hist ? col_grow_below : col_fall_below)), transp=0 )
plot(showMacd ? macd : na, title="MACD", color=col_macd, transp=0)
plot(showSignal ? signal : na, title="Signal", color=col_signal, transp=0)
plot(showCpv ? changePerVolume : na, color=changePerVolume > changePerVolume[1] ? color.teal : color.red)
plot(0, color=color.white, transp=80)
plot(showEma1 ? msEma1 : na, color=color.aqua)
plot(showEma2 ? msEma2 : na, color=color.yellow)
plot(showMs ? marketSentiment : na, color=color.lime)

//Strategy
strategy.entry("Buy", strategy.long, when=crossover(hist, 0))
strategy.close("Buy", when=crossunder(hist, 0))