Dual MACD Quantitative Trading Strategy

Overview
This strategy utilizes the combination of dual EMA systems and RSI indicators to determine market trends while generating trading signals. It belongs to the trend following strategies. This simple and easy-to-use strategy is applicable to various major indices and cryptocurrencies. It has achieved over 500% cumulative returns in backtests from 2013 to present.
Strategy Logic
This strategy employs two MACDs with different parameter settings as the primary trading indicators. The first MACD adopts 10-period short EMA, 22-period long EMA, and 9-period signal line. The second MACD uses 21-period short EMA, 45-period long EMA, and 20-period signal line.
The first MACD generates buy signals when the DIFF line crosses above zero, and sell signals when crossing below zero. The signals from the second MACD act to confirm those from the first MACD.
In addition, the strategy utilizes a price momentum formula to determine the trend. The latest close + high divided by previous close + high above 1 indicates an upward trend and generates buy signals, and vice versa for sell signals.
Lastly, Stoch RSI K line above 20 helps confirm sell signals.
Advantage Analysis
The dual EMA mechanism in this strategy can effectively filter false breakouts. The supplementary momentum formula also avoids wrong signals caused by volatility. The incorporation of Stoch RSI avoids chasing tops by issuing sell signals around overbought areas.
This strategy only uses simple combinations of several common indicators without overly complex logic relationships, which makes it very easy to understand and modify. The parameter settings are also quite universal without the need for optimization for different products, giving the strategy great adaptability.
According to backtest results, this strategy has achieved decent cumulative returns and maximum drawdown control across various products like stock indices and cryptocurrencies. It can serve as a versatile trend following strategy.
Risk Analysis
The main risk of this strategy lies in using moving averages for determinations, which can easily cause whipsaws and losses when prices fluctuate violently. In addition, there is no stop loss mechanism to control losses on single positions.
The effectiveness of Stoch RSI in detecting overbought/oversold levels is not ideal. It may miss reversal signals frequently.
If prices crash sharply but MACD has not formed a death cross yet, this strategy will hold onto losing positions and continue taking losses.
Optimization Directions
Consider adding stop loss to control single position losses, e.g. ATR stop loss or stop loss based on lower moving averages.
Add other indicators for confirmation, such as combining KD or Bollinger Bands with Stoch RSI for more reliable overbought/oversold detection.
Incorporate volume analysis, like raising stop loss when significant selling volume appears, or avoiding new positions when volume is weak.
Test different parameter combinations and optimize MACD periods. Also test adding MACDs of other timeframes for multiple confirmation.
Conclusion
The dual MACD quantitative trading strategy has simple and clear logic, using dual EMA crossovers to determine trends, supplemented by momentum indicators to avoid wrong signals. It can filter out high-probability trading opportunities. The universal parameter settings and solid performance make it a good foundation strategy to build upon. The next steps are to further enhance its stability and profitability by improving stop loss mechanisms, adding volume analysis, combining other indicators, etc.
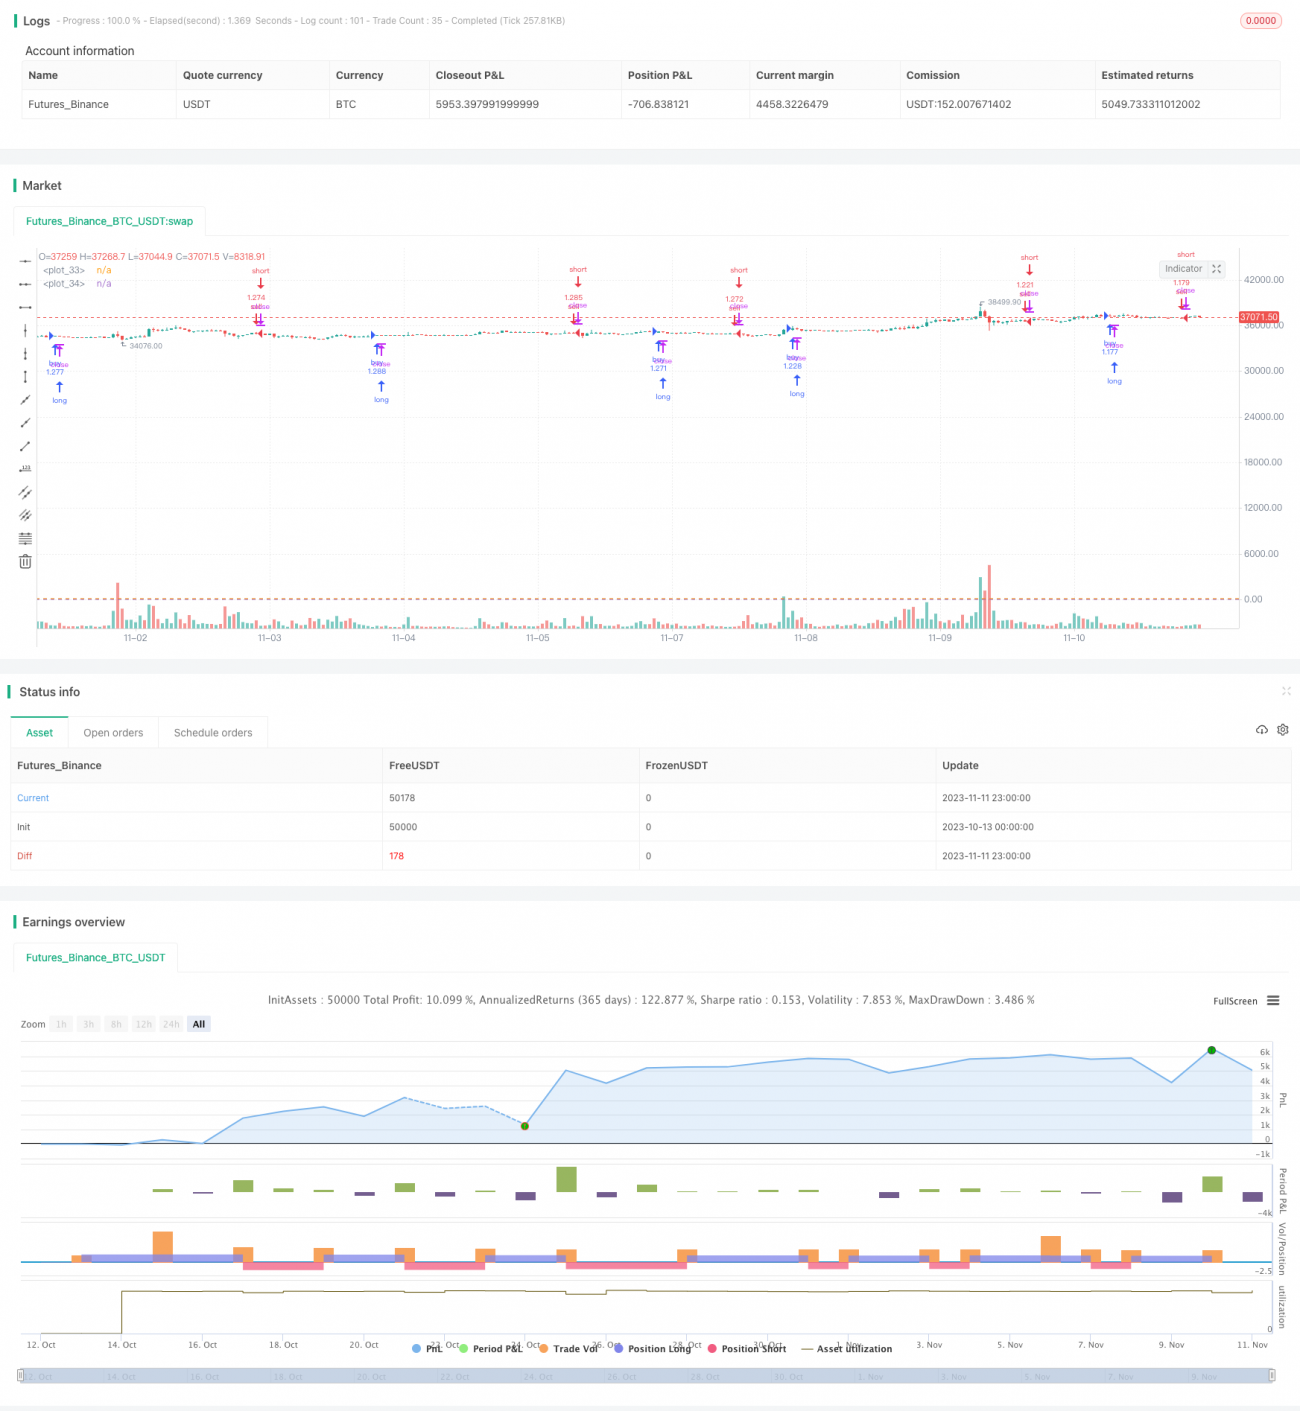
/*backtest
start: 2023-10-13 00:00:00
end: 2023-11-12 00:00:00
period: 1h
basePeriod: 15m
exchanges: [{"eid":"Futures_Binance","currency":"BTC_USDT"}]
*/

//@version=2
strategy("Multiple MACD RSI simple strategy", overlay=true, initial_capital=5000, default_qty_type=strategy.percent_of_equity, default_qty_value=80, pyramiding=0, calc_on_order_fills=true)

fastLength = input(10)- 1