MCL-YG Bollinger Band Breakout Pair Trading Strategy

Overview
This strategy uses Bollinger Band breakouts to generate trading signals and implement pair trading between two positively correlated assets MCL and YG. It goes long MCL and short YG when MCL price touches the upper band, and goes short MCL and long YG when MCL price touches the lower band, to trade along the price trend.
Strategy Logic
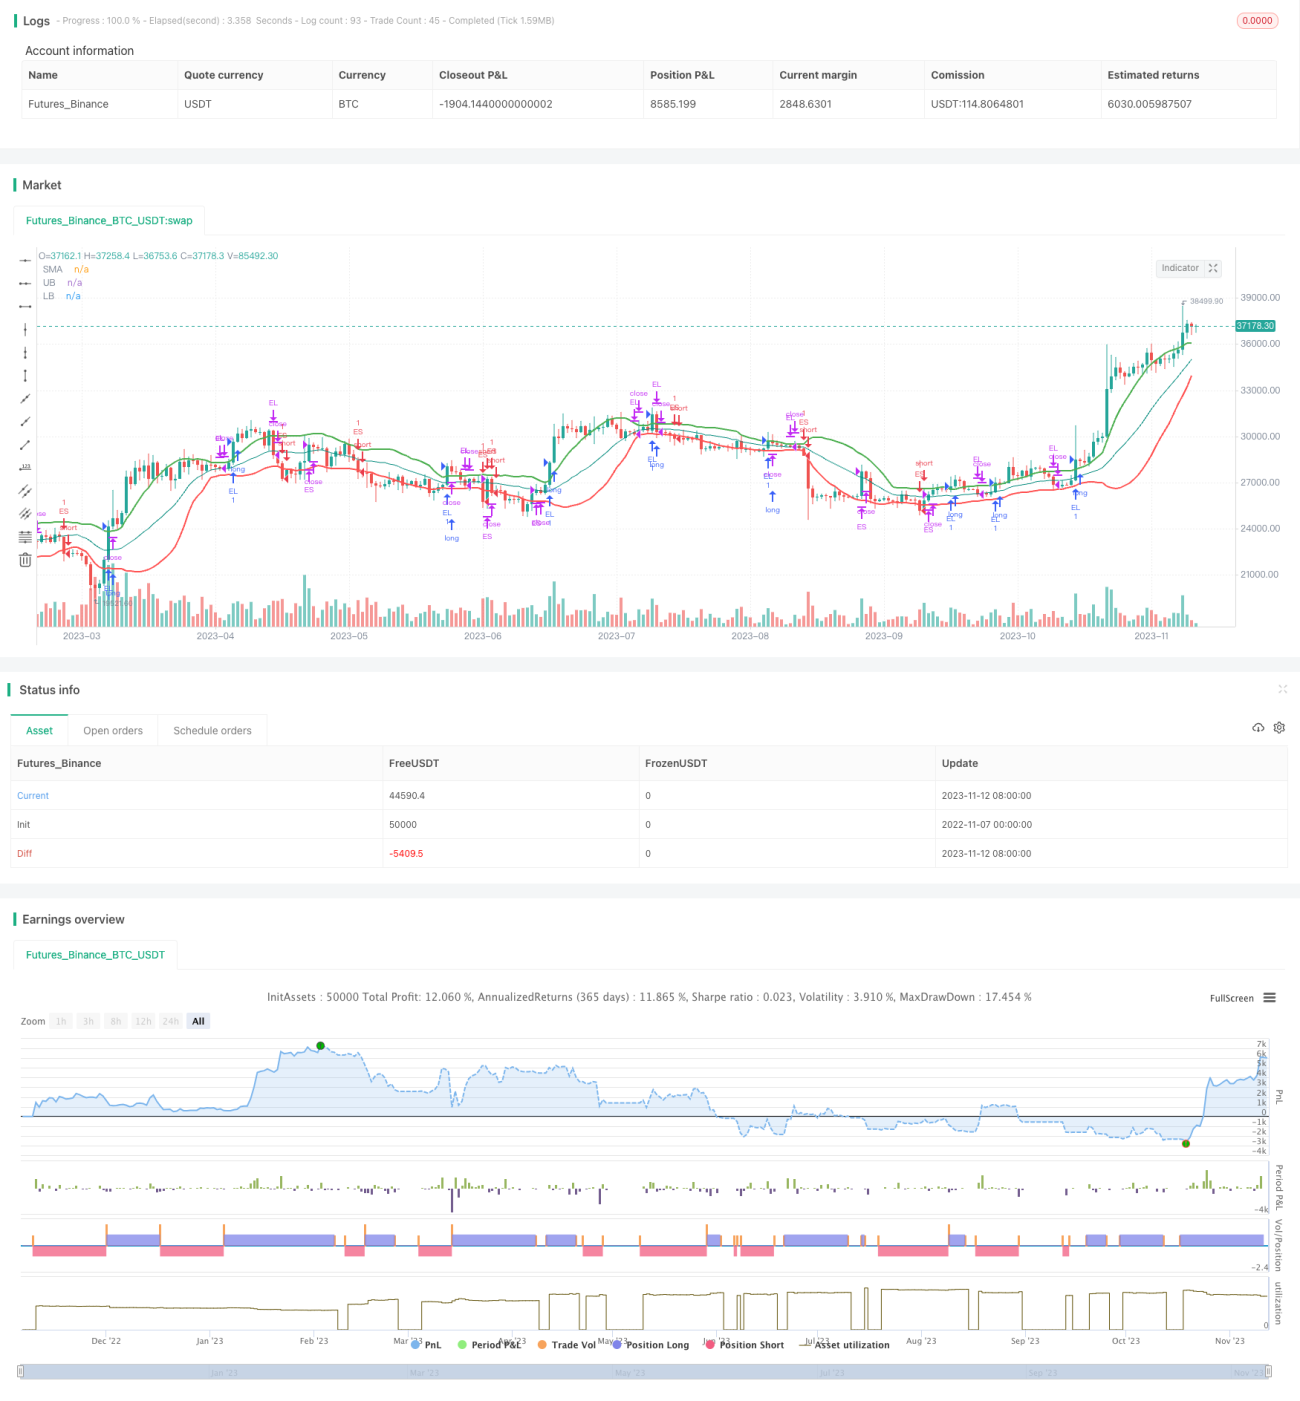
Firstly, the strategy calculates the SMA line and StdDev based on closing prices over a certain period. Then it adds an offset above and below the SMA to form the upper and lower bands of the Bollinger Bands. A buy signal is generated when price touches the upper band, and a sell signal when price touches the lower band.
The strategy utilizes the breakout trading logic of Bollinger Bands - go long when price breaks above the upper band and go short when price breaks below the lower band. Bollinger Bands dynamically adjust the width of the bands based on market volatility, which helps filter out market noise during ranging periods. Unlike fixed channel bands, Bollinger Bands widen during high volatility and narrow during low volatility. This allows it to filter some noise when volatility is high, and capture smaller breakouts when volatility is low.
It implements pair trading between two positively correlated assets MCL and YG. When MCL breaks above the upper band, it shows MCL is in an uptrend. The strategy goes long MCL and short YG - buying the stronger asset and selling the weaker one, to benefit from the divergence in their prices.
Advantages
- Breakout trading based on Bollinger Bands can effectively filter market noise and identify trends
- Pair trading on correlated assets can gain alpha returns from price divergence
- Dynamic position sizing helps control risk for individual trades
- Standard breakout entry and reversion exit logic makes the strategy logic simple and clear
Risks
- Poor Bollinger Bands parameter tuning may lead to too many signals or unclear signals
- Declining correlation between the assets can reduce profits from the pair trading
- Breakouts may be fooled by false signals in choppy markets, causing losses
- No stop loss may lead to enlarged losses for single trades
Risks can be reduced by optimizing parameters, selecting assets with stronger correlation and liquidity, setting proper stop loss etc.
Optimization Opportunities
- Optimize Bollinger Bands parameters to find best combination
- Test more correlated asset pairs and select the best combination
- Add stop loss logic to limit losses for single trades
- Add more filters to avoid false breakout signals
- Incorporate other factors like volume confirmation to improve entry timing
Summary
Overall the strategy is simple and straightforward, capturing trends with Bollinger Bands and gaining alpha from pair trading. But there is room for improvement in parameters tuning, stop loss, and pair selection. Further testing of parameters, trading vehicles, trend filters etc. can improve the strategy performance.
- 1