Momentum Squeeze Strategy

Overview
The main idea of this strategy is to combine Lazy Bear's momentum indicator and Crypto Face's MFI indicator to go long when the trend goes up and go short when the trend goes down, realizing a quantitative trading strategy that follows market trends.
Strategy Logic
-
Use Lazy Bear's momentum indicator BlueWave, which calculates the linear regression of close price versus the 20-day highest high, lowest low and close average to determine the trend direction. When BlueWave crosses above 0, it indicates an upward trend; when it crosses below 0, it indicates a downward trend.
-
Use the improved MFI indicator by Crypto Face, which calculates the sum of price change and volume over the past 58 days to determine the money flow. MFI greater than 0 indicates money inflow, less than 0 indicates outflow.
-
When BlueWave crosses above 0 and MFI is greater than 0, a buy signal is generated to open a long position; when BlueWave crosses below 0 and MFI is less than 0, a sell signal is generated to open a short position.
-
Set stop loss and take profit conditions to follow the market trend for profit, while controlling risks.
Advantages
-
Combining two indicators can more accurately determine market trend direction.
-
BlueWave's smooth curve avoids bias from outliers, making trend judgement more reliable.
-
MFI can determine money flow, avoiding losses from false breakouts.
-
The strategy has few parameters and is easy to implement and operate.
-
Flexible stop loss and take profit settings help control trading risks.
-
Trading sessions can be set to avoid abnormal volatility during specific market times.
Risks
-
Continued downtrend may lead to successive short positions and losses.
-
False signals may lead to being trapped after entering positions.
-
Oversized stop loss may amplify losses.
-
High volatility may frequently hit stop loss points.
-
Improper parameter optimization may lead to poor strategy performance.
-
Too frequent trading signals may increase transaction costs and slippage.
Enhancement
-
Optimize parameters of BlueWave and MFI for more steady and reliable signals.
-
Incorporate trend indicators to avoid sustained short losses.
-
Dynamically adjust stop loss/take profit ratios to lower being trapped probability.
-
Refine entry conditions to reduce false signals.
-
Consider position sizing to avoid chasing rallies and dumping dips.
-
Combine with machine learning models for more accurate entry and exit points.
Conclusion
This strategy combines BlueWave and MFI indicators to determine trend direction, going long on uptrends and short on downtrends, effectively following market trends for profits. However, risks exist in parameter settings, stop loss/take profit, sustained downtrends etc, requiring further optimization on parameter tuning, stop loss mechanisms, filter conditions etc to improve strategy performance and robustness. Overall, the strategy is intuitive and works well for long-term trend following, but losses may be incurred when trapped in ranging markets.
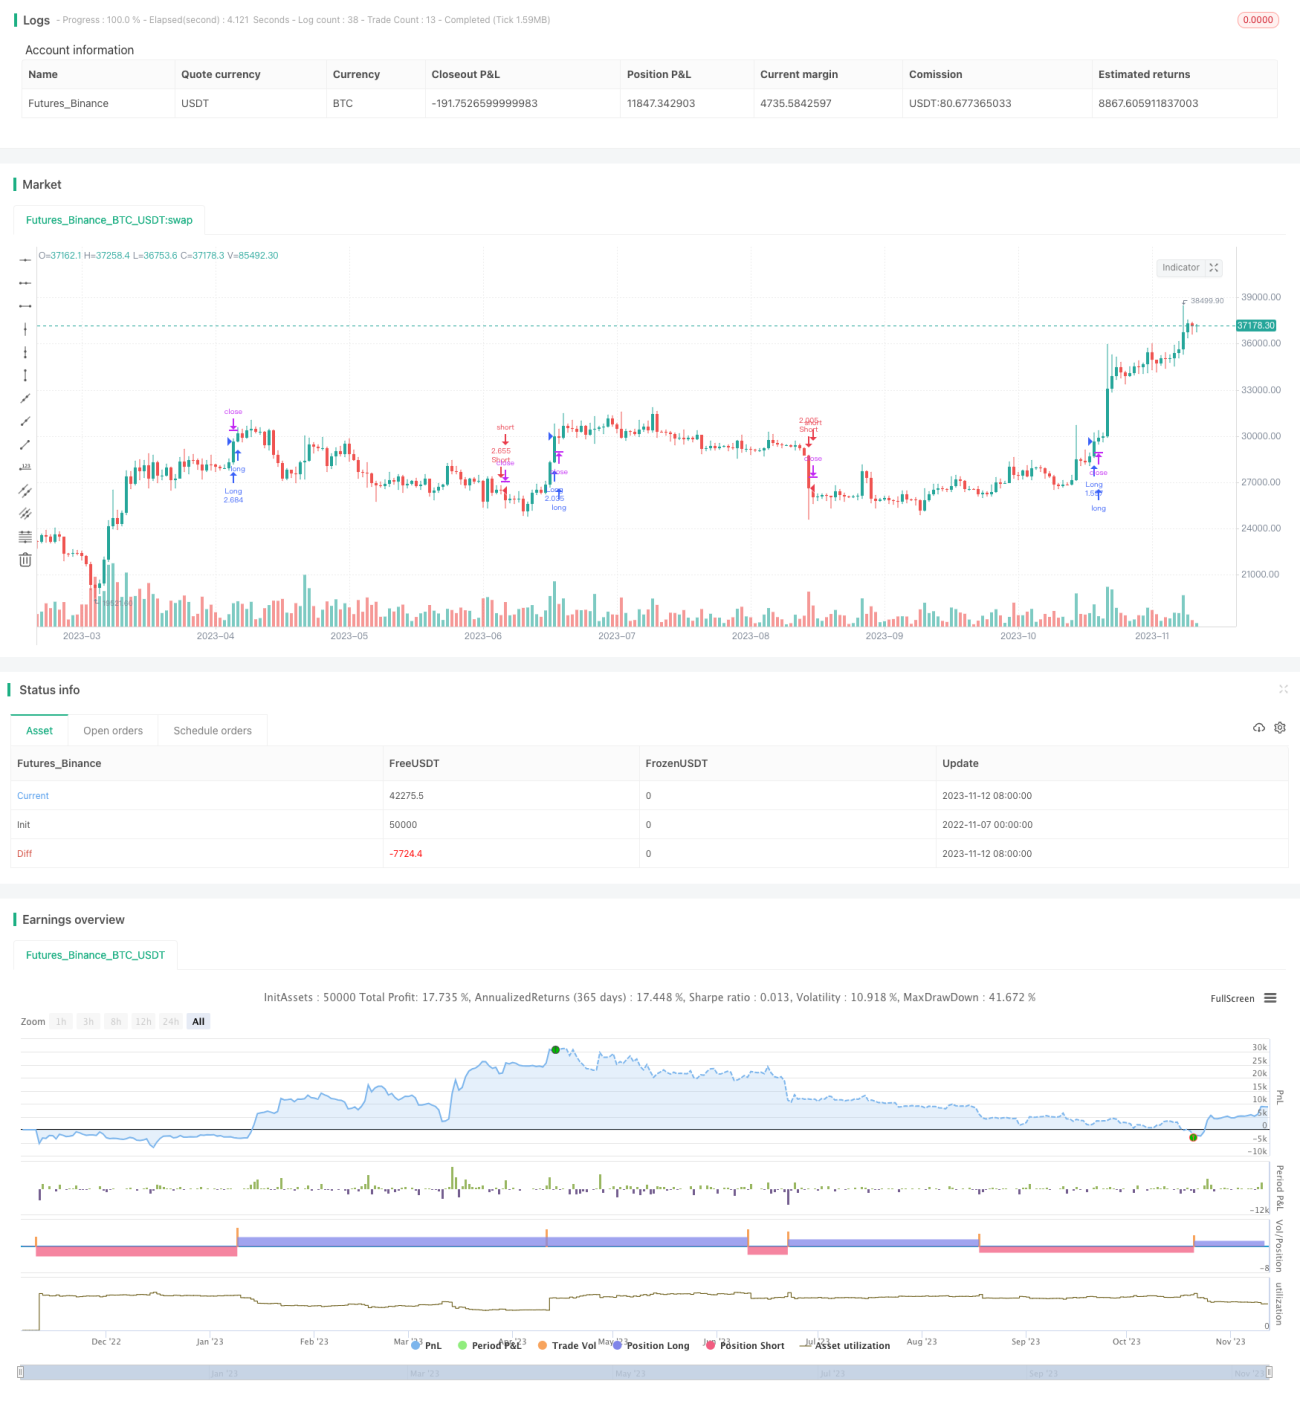
/*backtest
start: 2022-11-07 00:00:00
end: 2023-11-13 00:00:00
period: 1d
basePeriod: 1h
exchanges: [{"eid":"Futures_Binance","currency":"BTC_USDT"}]
*/

// @version=4
// This source code is subject to the terms of the Mozilla Public License 2.0 at https://mozilla.org/MPL/2.0/
// © Bunghole 2021
strategy(title="Crypto Squeeze Strategy", initial_capital = 100000, default_qty_type = strategy.percent_of_equity, default_qty_value = 100, pyramiding = 0, currency = 'USD', overlay=true)- 1