Dual-track Oscillator Pattern Strategy

Overview
The Dual-track Oscillator Pattern strategy is a quantitative trading strategy based on Bollinger Bands and EMA indicators. It attempts to capture short-term price fluctuations through identifying oscillator patterns based on Bollinger Bands and EMA.
Strategy Logic
The strategy uses both Bollinger Bands and EMA as technical indicators. Bollinger Bands contain upper, middle and lower bands to judge if price is oscillating. EMA is a trend following indicator to determine price trend.
First, the middle band of Bollinger Bands is calculated as the n-day simple moving average of price, where n defaults to 20 days. The upper and lower bands are middle band plus/minus two standard deviations. Then the 9-day EMA is calculated.
When price crosses above EMA, it is a buy signal. When price crosses below EMA, it is a sell signal. So EMA as a fast moving average captures short-term trend, while the middle band as a slow moving average filters some false signals.
By tracking dual bands of EMA and Bollinger Bands middle line, the strategy aims to capture short-term price oscillations. It buys when EMA crosses above middle line, and sells when EMA crosses below middle line.
Advantage Analysis
The dual-track strategy has the following advantages:
-
Using EMA and Bollinger Bands middle line dual tracks, it can judge both trend and oscillation, and more accurately capture short-term price fluctuations.
-
EMA as fast MA and middle band as slow MA work together to effectively filter false signals and improve signal quality.
-
Indicator parameters are adjustable. The n value and Bollinger Bands standard deviation can be adjusted according to market conditions for better adaptability.
-
The strategy logic is simple and clear, very suitable for short-term oscillating markets.
-
It can be optimized by adjusting parameters and incorporating other filters to further improve stability.
Risk Analysis
The strategy also has some potential risks:
-
Bollinger Bands upper and lower bands can form support and resistance easily, triggering premature stop loss.
-
Divergence may happen between EMA and middle band when they cross, generating incorrect signals.
-
In strong trending markets, EMA may form W-bottoms and M-tops, missing the trend.
-
Trading signals will reduce significantly when oscillation weakens, unable to sustain profitability.
-
Inadequate parameter tuning may lead to overtrading or missing opportunities.
-
Transaction costs erode actual profits, position sizing needs control.
Optimization Directions
The strategy can be optimized in the following aspects:
-
Add volume to filter low quality crossover signals.
-
Combine RSI to avoid buying/selling in overbought/oversold levels.
-
Use ATR to set more reasonable stop loss and take profit.
-
Add trend judgment to avoid wrong signals in trending markets.
-
Optimize parameters like EMA period and Bollinger Bands settings to suit different market environments.
-
Use machine learning to dynamically optimize parameters for robustness.
-
Adopt algorithmic trading with strict entry and exit rules to minimize human interference.
Summary
The Dual-track Oscillator Pattern strategy tracks price using dual bands of EMA and Bollinger Bands middle line. It buys when EMA crosses above middle band, and sells when EMA crosses below middle band, to capture short-term price oscillations. This simple short-term strategy has the advantage of filtering false signals and judging trends, but also has some risks. By continuously optimizing parameters, entry/exit rules etc., it can become more robust and applicable to more market environments, making it a worthwhile strategy approach to learn and apply.
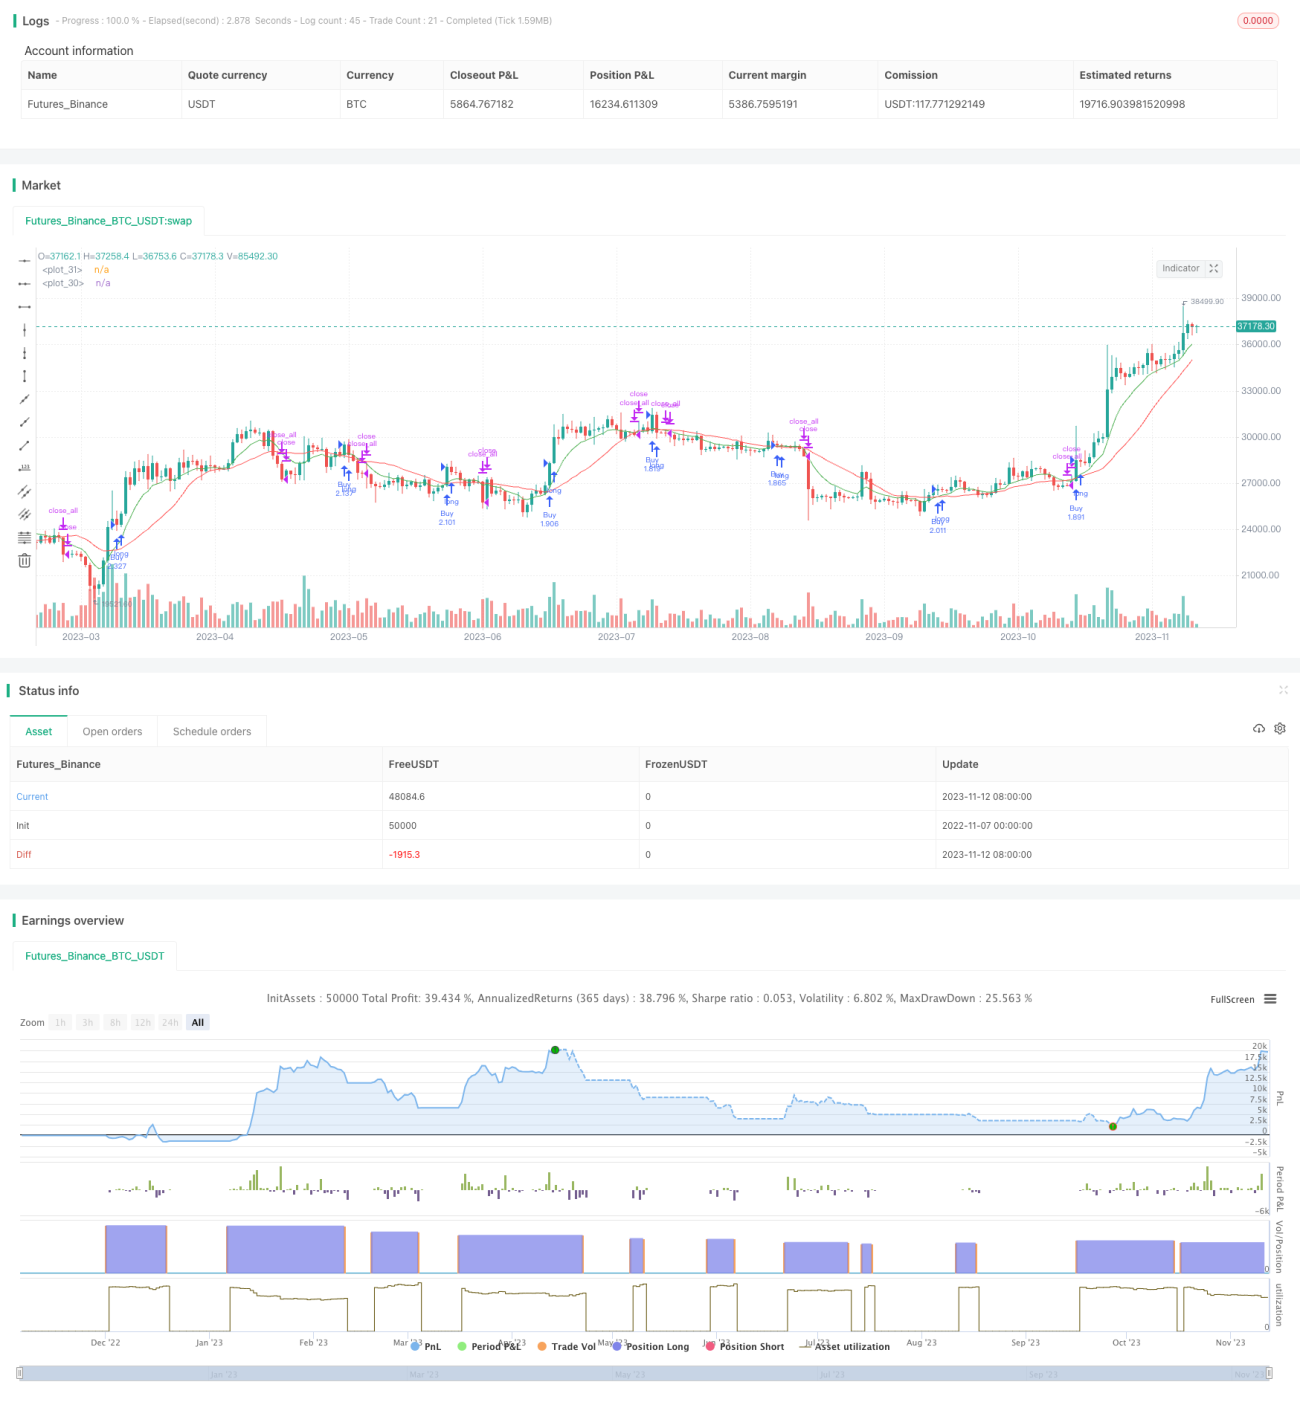
/*backtest
start: 2022-11-07 00:00:00
end: 2023-11-13 00:00:00
period: 1d
basePeriod: 1h
exchanges: [{"eid":"Futures_Binance","currency":"BTC_USDT"}]
*/

//@version=4
strategy(shorttitle="BBXEMA", title="Bollinger Bands Cross EMA", default_qty_type=strategy.percent_of_equity, default_qty_value=100, overlay=true)
length = input(20, minval=1)
lengthEMA = input(9)- 1