Quantitative Trading Strategy Based on Improved Vortex Indicator

Overview
This strategy is an upgraded version of the Vortex Indicator strategy. Based on the original Vortex Indicator, it incorporates several new features, including triggering trades based on threshold, smoothing vortex lines with EMA, adding stop loss and take profit, implementing long-only, short-only or long/short strategies, etc. It is suitable for investors who want to apply improved Vortex Indicator in quantitative trading.
Principles
The core indicator of this strategy is the improved Vortex Indicator. The traditional Vortex Indicator forms positive and negative vortex lines by calculating the absolute sum of price fluctuations. When the positive line crosses above the negative line, it sends a buy signal. When the negative line crosses below the positive line, it sends a sell signal.
This strategy makes the following upgrades to the traditional Vortex Indicator:
-
Instead of solely relying on line crosses, it introduces the concept of threshold. Trades are triggered only when the spread between the positive and negative lines exceeds a preset threshold. This helps filter out small, insignificant crosses.
-
The vortex lines are smoothed with EMA to reduce curve jitters.
-
Stop loss and take profit functionalities are added. Loss/profit ratios can be pre-set for better risk control.
-
Traders can choose between long-only, short-only or long/short strategies to suit different needs.
With these improvements, the strategy can more reliably detect trends and performs well in backtests.
Advantage Analysis
-
The improved Vortex Indicator filters out invalid signals and avoids false breaks. EMA smoothing also helps reduce noise.
-
Using threshold for signals instead of simple crosses can more reliably detect trend reversal points.
-
The stop loss/take profit features allow pre-setting profit/loss ratios to control risks for each trade, aligning with rational trading principles.
-
Choosing between long-only, short-only or long/short provides flexibility to adapt to different market stages and suit needs of different traders.
-
The strategy has well-designed parameters and good backtest results, giving it practical value.
Risk Analysis
-
The strategy mainly works for trending markets. Performance may suffer during range-bound markets.
-
Vortex lines are inherently sensitive to price fluctuations. Improper settings may cause over-trading.
-
If threshold is set too high, it may miss trades. If set too low, it may generate false signals. Extensive testing is needed to find the optimal levels.
-
Stop loss may be taken out during black swan events. Traders need to be alert about this risk.
Optimization Directions
-
Consider combining with other indicators for signal confirmation and more comprehensive judgments.
-
Test parameter sensitivity across different stocks and optimize settings.
-
Research adaptive stop loss techniques to adjust stops along the major trend.
-
Introduce machine learning etc. to auto-optimize parameters.
-
Explore indexation methods based on this strategy to expand capacity.
Conclusion
This strategy makes multiple enhancements over the traditional Vortex Indicator and forms a relatively mature and reliable quantitative trading system. Combining trend filtering and risk control, it avoids overfit risks from scattered trades and utilizes the trend capture capabilities of the indicator itself. With further parameter optimization and combination techniques, the strategy can be made more stable and responsive. Overall, it holds practical value as an upgraded version of the Vortex Indicator strategy.
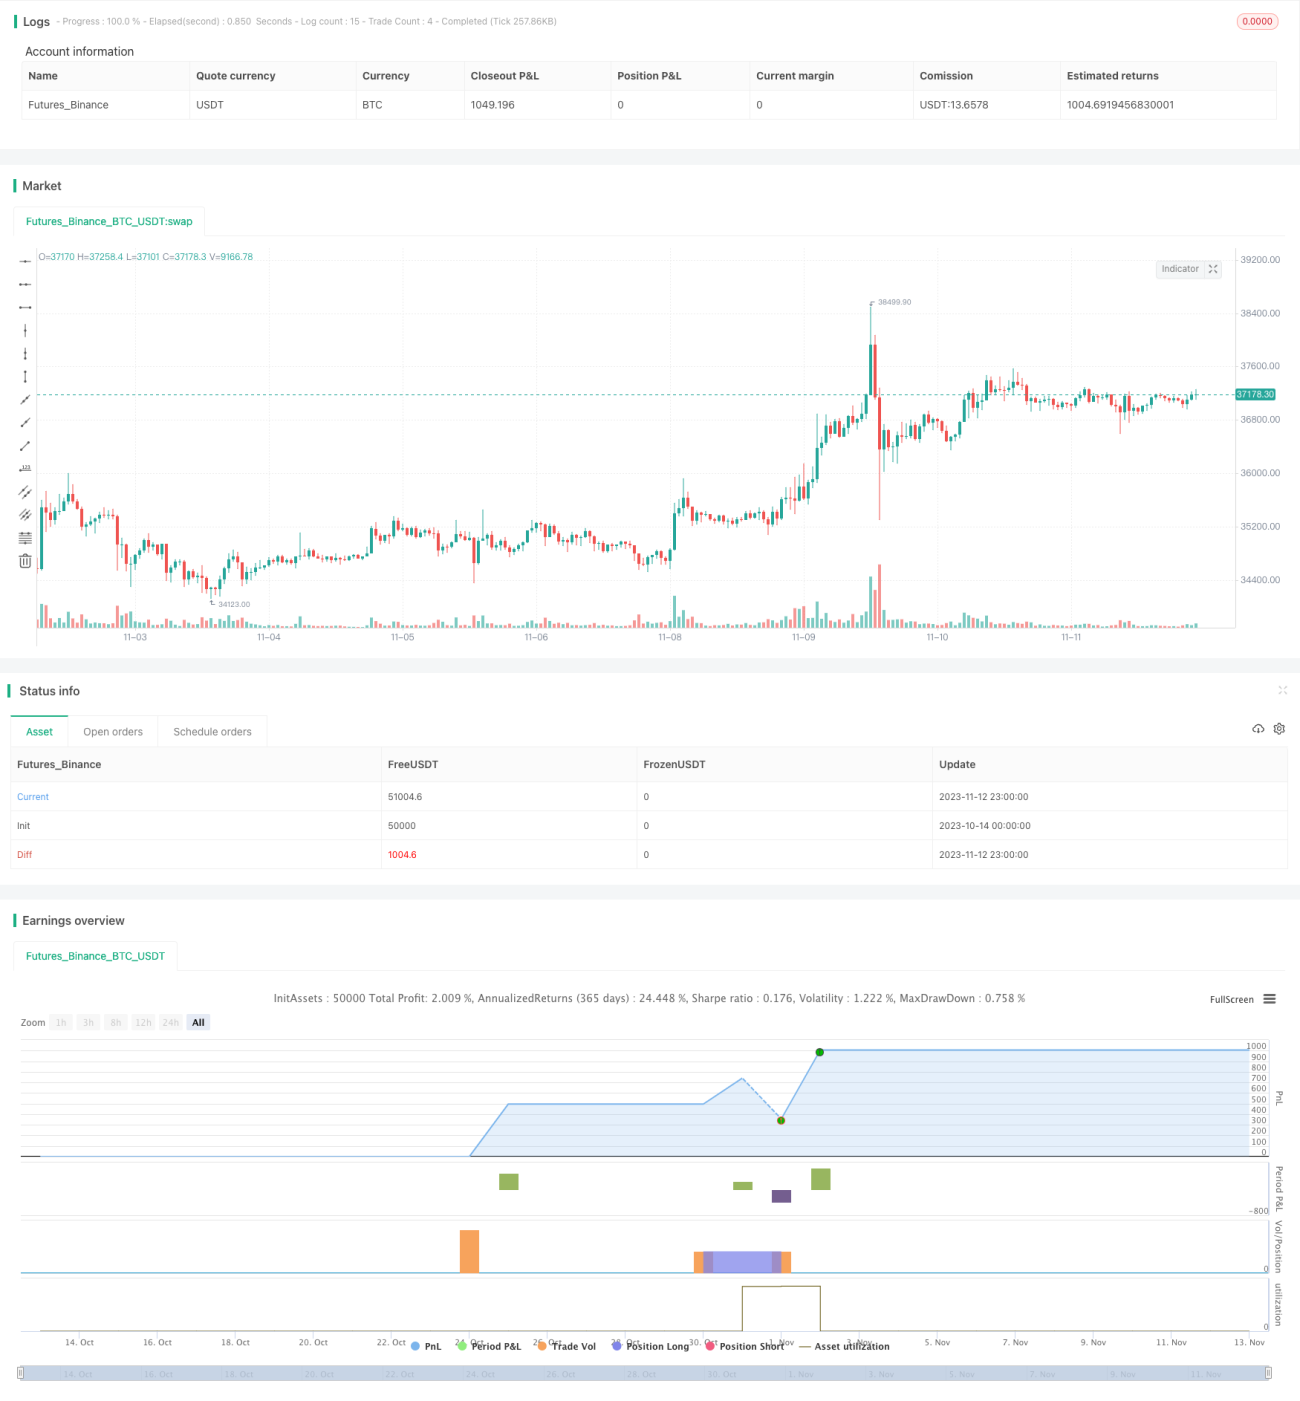
/*backtest
start: 2023-10-14 00:00:00
end: 2023-11-13 00:00:00
period: 1h
basePeriod: 15m
exchanges: [{"eid":"Futures_Binance","currency":"BTC_USDT"}]
*/

// [Guz] Custom Vortex
// Custom version of the Vortex indicators that adds many features:
// -Triggers trades after a threshold is reached instead of the normal vortex lines cross (once the difference between the 2 lines is important enough)
// -Smooths the Vortex lines with an EMA- 1