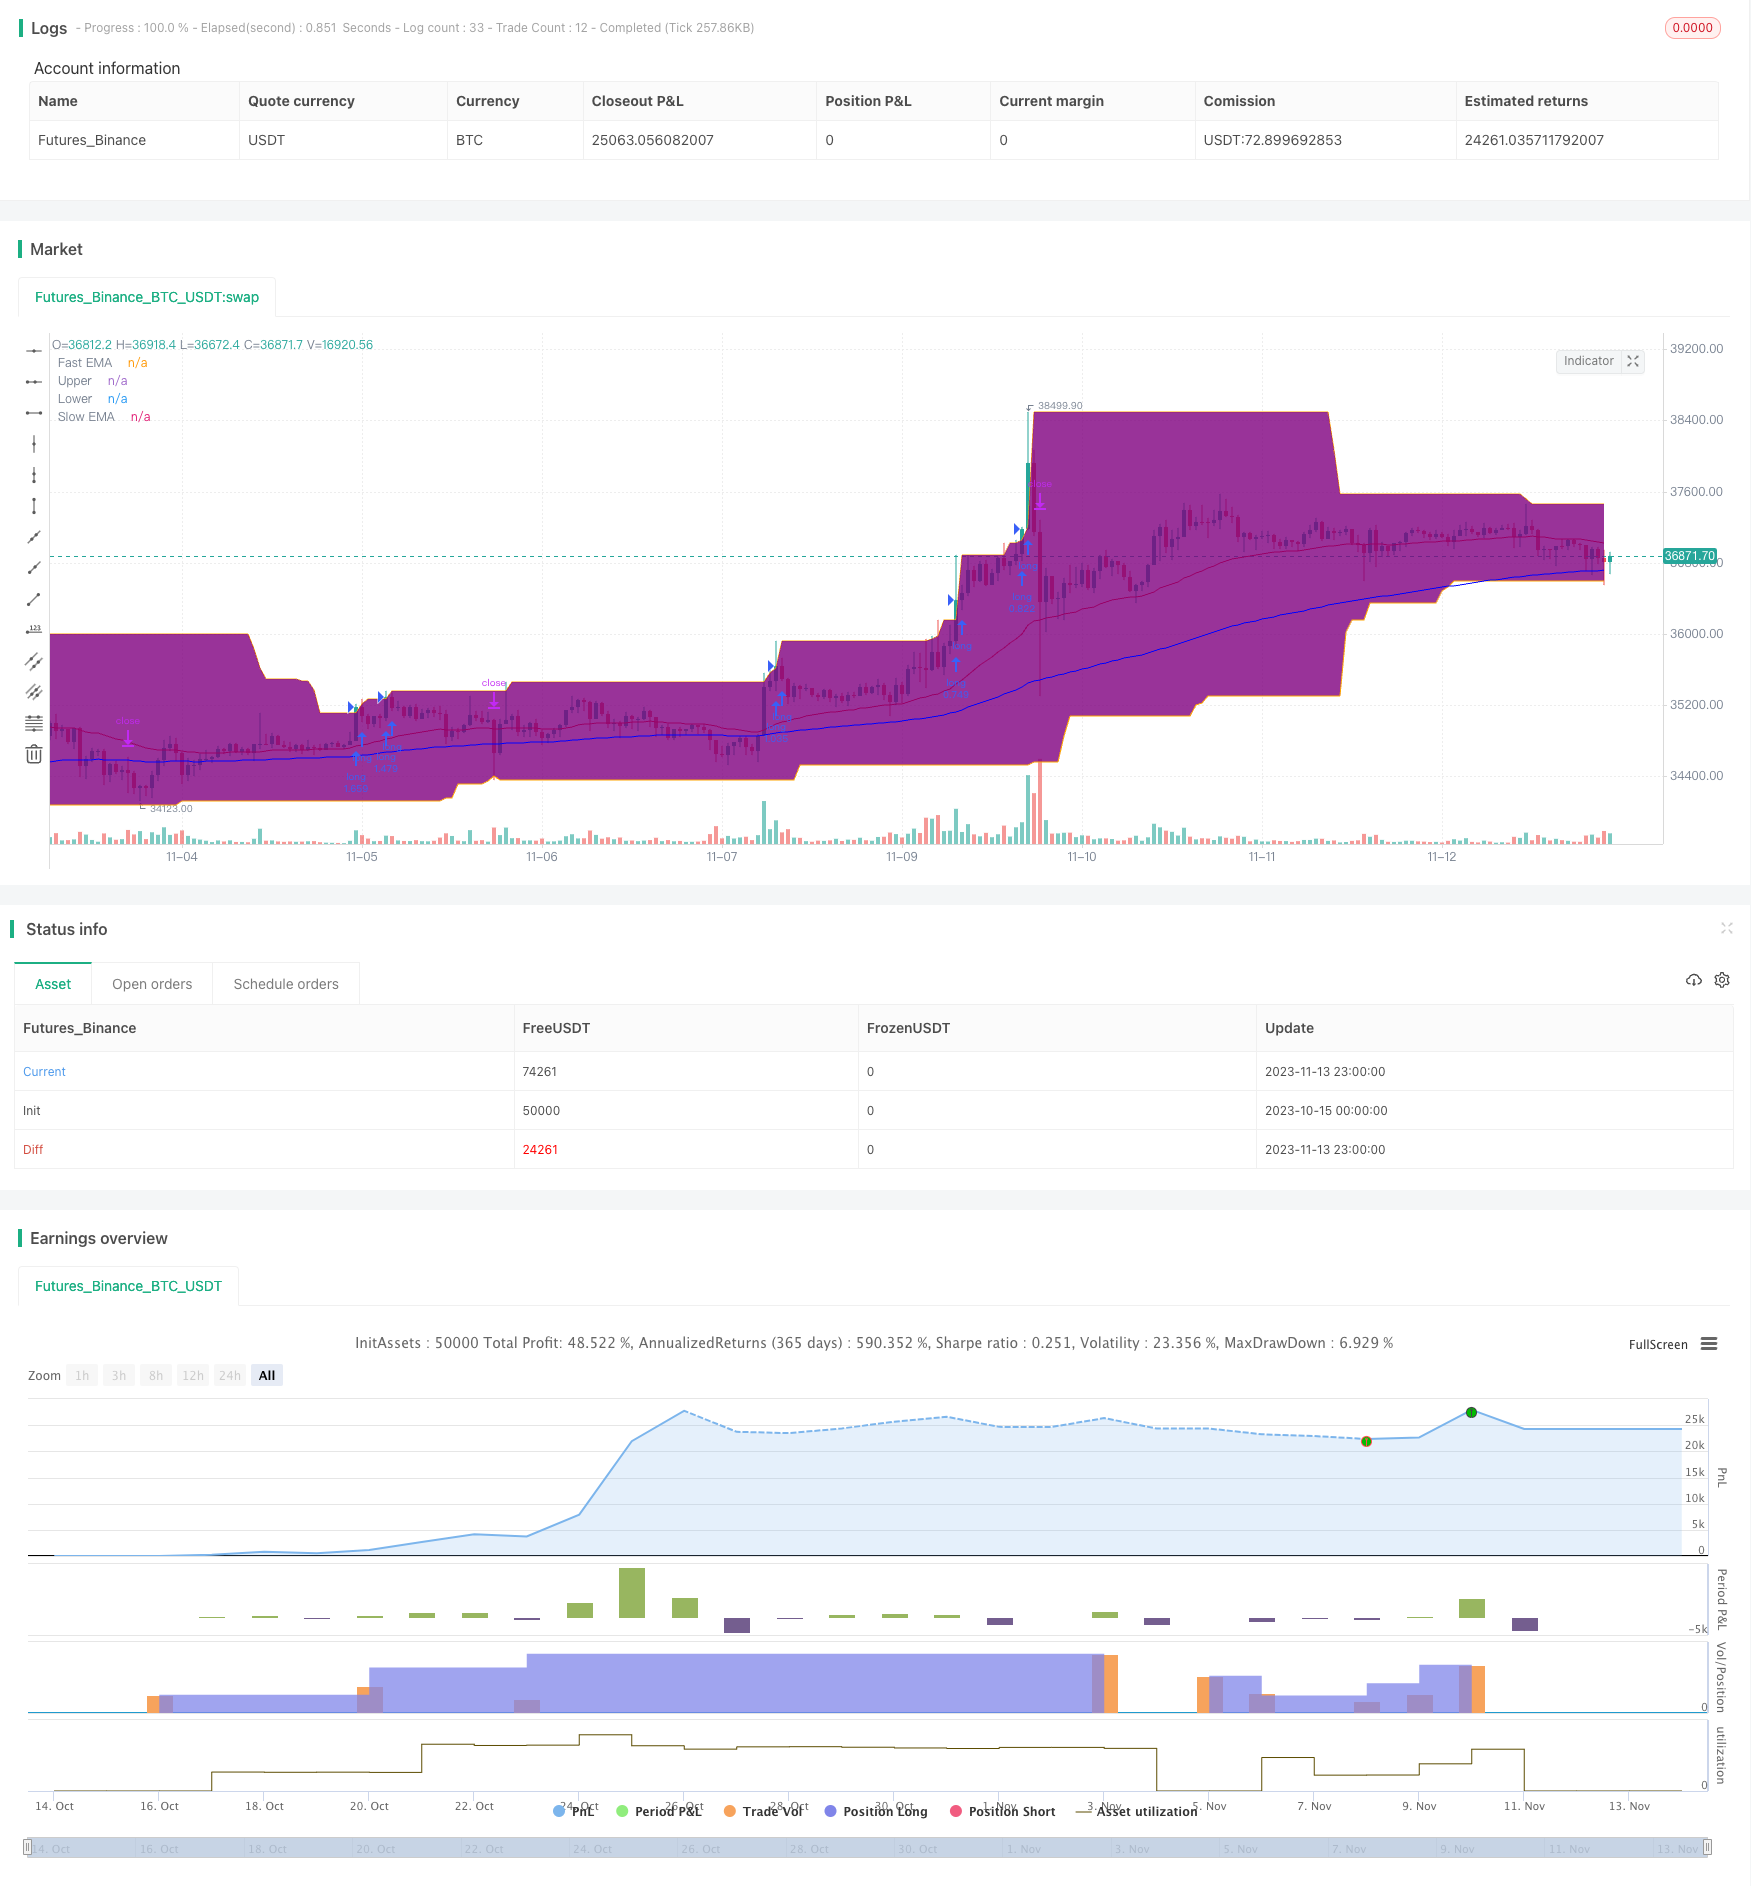
概述
本策略是一种经典的趋势跟踪系统。它利用移动平均线的金叉死叉来判断趋势方向,并在突破唐奇安通道时入场。唐奇安通道的参数设置为50日,可有效过滤掉短期市场噪音。移动平均线设置为40日和120日的指数移动平均线,可以更好地捕捉中长线趋势。止损点设置为价格之下的4倍ATR,可有效控制个别交易的损失。
策略原理
该策略主要基于以下几个要点:
使用40日和120日的指数移动平均线构建趋势判断指标。当快线从下方上穿慢线时,为金叉信号,表明进入上涨趋势;当快线从上方下穿慢线时,为死叉信号,表明进入下跌趋势。
唐奇安通道参数设置为50日,过滤市场短期波动。只有当价格突破上轨时才做多,突破下轨时才做空,避免被套。
止损点设置为价格之下的4倍ATR。ATR可有效衡量市场波动度和风险,设置止损为其一定倍数可以控制单笔交易的损失。
指数移动平均线更符合当前价格趋势,而简单移动平均线过于平滑。
50日通道期限与40、120日均线配合使用,能够有效过滤假突破。
优势分析
该策略具有以下优势:
移动平均线组合可以有效判断市场趋势方向。40日均线可捕捉短期趋势,120日均线可判断中长线趋势。
唐奇安通道过滤噪音,避免追高杀跌。只有价格突破通道才入场,可以有效避免交易市场中间的震荡区域。
止损点设定合理,可以控制单笔交易损失,避免爆仓。单笔损失控制则可以保证盈利的可持续性。
指数移动平均线更符合价格变化趋势,系统的持仓时间可以更长,符合趋势交易思路。
移动平均线参数选取兼顾了捕捉趋势的灵敏度和过滤噪音的稳定性。
风险分析
该策略也存在一些风险:
长期持仓带来的风险:本策略属于趋势跟踪策略,当出现长期横盘整理,或者趋势反转时,将面临较大亏损。
假突破风险:当价格触及通道附近时,可能出现一定比例的假突破,从而导致不必要的交易。
参数设置风险:移动平均线和通道参数的设置过于主观,不同市场需要调整参数组合,否则会影响系统稳定性。
止损点过小风险:设置的止损点过小,将面临过多的停损出场,影响盈利。
对应解决方法: 1. 谨慎决定持仓时间,防止长期持仓带来的风险。 2. 优化参数,使突破信号更稳定可靠。 3. 测试不同市场的数据,优化参数组合。 4. 适当放宽止损点,防止过于频繁停损。
优化方向
本策略可以从以下几个方向进行优化:
测试不同均线的组合,寻找最佳参数组合。可以测试各种简单、指数、Hull等移动平均线的组合。
对通道周期和参数进行优化,使突破信号更有效。可以结合市场的波动频率进行优化。
优化止损策略,在趋势运行中采用趋势跟踪止损,趋势结束后采用固定止损。
利用MACD、KD等指标进行多因子验证,提高信号的准确率。
增加仓位管理策略,在趋势运行中加仓,优化盈利。
根据不同品种特点选择参数组合,使系统参数鲁棒性更强。
总结
本策略整体作为一个趋势跟踪系统较为典型和简单。核心在于移动平均线的运用和通道的突破过滤。止损策略也经典而实用。本策略可作为量化系统开发的基础框架,也可直接投入使用,收益也较为稳定。通过优化测试可以进一步提高系统的稳定性和收益率。总体来说,本策略具有易操作性与通用性,适合作为量化交易的基础策略之一。
/*backtest
start: 2023-10-15 00:00:00
end: 2023-11-14 00:00:00
period: 1h
basePeriod: 15m
exchanges: [{"eid":"Futures_Binance","currency":"BTC_USDT"}]
*/

// This source code is subject to the terms of the Mozilla Public License 2.0 at https://mozilla.org/MPL/2.0/
// © Robrecht99

//@version=5
strategy("Long Term Trend Following System", overlay=true, margin_long=0, margin_short=0, pyramiding=4)

// Backtest Range //

Start = input(defval = timestamp("01 Jan 2017 00:00 +0000"), title = "Backtest Start Date", group = "backtest window")
Finish = input(defval = timestamp("01 Jan 2100 00:00 +0000"), title = "Backtest End Date", group = "backtest window")

//Moving Averages //

len1 = input.int(40, minval=1, title="Length Fast EMA", group="Moving Average Inputs")
len2 = input.int(120, minval=1, title="Length Slow EMA", group="Moving Average Inputs")
src1 = input(close, title="Source Fast MA")
src2 = input(close, title="Source Slow MA")
maFast = input.color(color.new(color.red, 0), title = "Color Fast EMA", group = "Moving Average Inputs", inline = "maFast")
maSlow = input.color(color.new(color.blue, 0), title = "Color Slow EMA", group = "Moving Average Inputs", inline = "maSlow")
fast = ta.ema(src1, len1)
slow = ta.ema(src2, len2)
plot(fast, color=maFast, title="Fast EMA")
plot(slow, color=maSlow, title="Slow EMA")

// Donchian Channels //

Length1 = input.int(title="Length Upper Channel", defval=50, minval=1, group="Donchian Channels Inputs")
Length2 = input.int(title="Length Lower Channel", defval=50, minval=1, group="Donchian Channels Inputs")
h1 = ta.highest(high[1], Length1)
l1 = ta.lowest(low[1], Length2)
fillColor = input.color(color.new(color.purple, 95), title = "Fill Color", group = "Donchian Channels Inputs")
upperColor = input.color(color.new(color.orange, 0), title = " Color Upper Channel", group = "Donchian Channels Inputs", inline = "upper")
lowerColor = input.color(color.new(color.orange, 0), title = " Color Lower Channel", group = "Donchian Channels Inputs", inline = "lower")
u = plot(h1, "Upper", color=upperColor)
l = plot(l1, "Lower", color=upperColor)
fill(u, l, color=fillColor)
strategy.initial_capital = 50000
//ATR and Position Size //

length = input.int(title="ATR Period", defval=14, minval=1, group="ATR Inputs")
risk = input(title="Risk Per Trade", defval=0.01, group="ATR Inputs")
multiplier = input(title="ATR Multiplier", defval=2, group="ATR Inputs")
atr = ta.atr(length)
amount = (risk * strategy.initial_capital / (multiplier * atr))

// Buy and Sell Conditions //

entrycondition1 = ta.crossover(fast, slow)
entrycondition2 = fast > slow
sellcondition1 = ta.crossunder(fast, slow)
sellcondition2 = slow > fast

// Buy and Sell Signals //

if (close > h1 and entrycondition2)
    strategy.entry("long", strategy.long, qty=amount)
    stoploss = close - atr * 4
    strategy.exit("exit sl", stop=stoploss, trail_offset=stoploss)
if (sellcondition1 and sellcondition2)
    strategy.close(id="long")

if (close < l1 and sellcondition2)
    strategy.entry("short", strategy.short, qty=amount)
    stoploss = close + atr * 4
    strategy.exit("exit sl", stop=stoploss, trail_offset=stoploss)
if (entrycondition1 and entrycondition2)
    strategy.close(id="short")