Momentum Reversal Trading Strategy

Author: ChaoZhang, Date: 2023-11-15 15:36:39
Tags:

img

Overview

This strategy combines the 123 reversal pattern and Ease of Movement (EOM) to trade at turning points. The 123 reversal pattern generates signals when the price forms specific patterns over 3 consecutive days. The EOM strategy utilizes changes in price and volume to gauge market momentum. The combination of both strategies considers technical patterns as well as momentum, improving the accuracy of trading signals.

Strategy Logic

The strategy consists of two components:

  1. 123 Reversal Pattern
  • Use Stoch to identify overbought and oversold levels
  • Go short when price falls for 2 consecutive days and Stoch fast line is above slow line
  • Go long when price rises for 2 consecutive days and Stoch fast line is below slow line
  1. Ease of Movement
  • Calculate midpoint of previous day’s range
  • Calculate change in midpoint relative to previous day
  • Calculate ratio of midpoint move and volume
  • Ratio above threshold indicates bullish, below threshold bearish

The strategy goes long when EOM and 123 signals align on the long side, and goes short when signals align on the short side.

Advantage Analysis

The advantages of this strategy:

  1. Combines price patterns and momentum for better signal accuracy

  2. 123 pattern catches turning points, EOM gauges trend momentum, two complement each other

  3. Stoch avoids whipsaws during consolidation

  4. Simple and easy to implement

  5. Customizable parameters for different market environments

Risk Analysis

The risks to consider:

  1. Overly reliant on parameter settings, improper settings may lead to overtrading or missing trades

  2. Many filters may generate too few signals

  3. EOM sensitive to volatility, may generate false signals

  4. Live performance weaker than backtest, need to control position sizing

  5. Only suitable for trending stocks, not ranging markets

Improvement Directions

The strategy can be improved by:

  1. Optimizing parameters to balance frequency and quality of signals

  2. Adding stop loss to control single trade loss

  3. Adding trend filter to avoid counter-trend trades

  4. Incorporating position sizing based on volatility

  5. Using machine learning to dynamically optimize parameters

Conclusion

This strategy integrates price patterns and momentum for high practical value. But trading frequency, loss control and counter-trend risks need to be managed. Further improvements in parameters, stop loss, trend filtering can enhance stability and profitability. The logic is clear and easy to implement for quant traders.
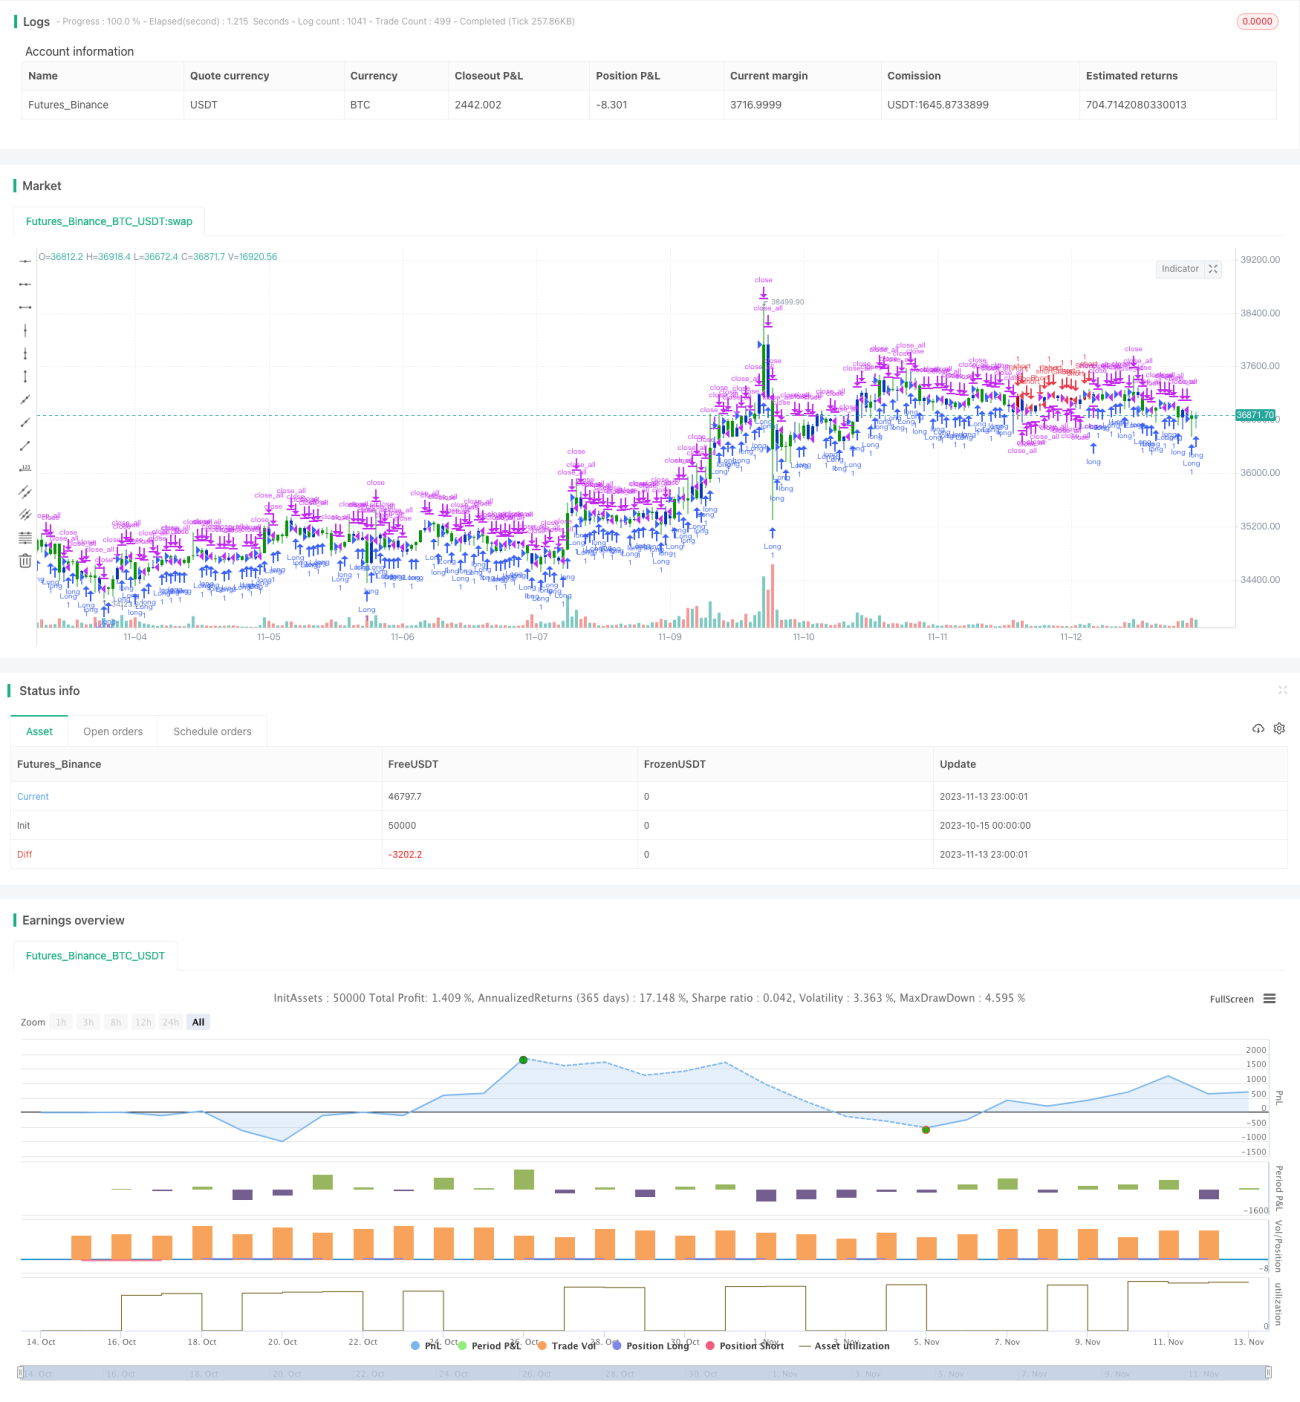

/*backtest
start: 2023-10-15 00:00:00
end: 2023-11-14 00:00:00
period: 1h
basePeriod: 15m
exchanges: [{"eid":"Futures_Binance","currency":"BTC_USDT"}]
*/

//@version=4
////////////////////////////////////////////////////////////
//  Copyright by HPotter v1.0 14/04/2020
// This is combo strategies for get a cumulative signal. 
//
// First strategy
// This System was created from the Book "How I Tripled My Money In The 
// Futures Market" by Ulf Jensen, Page 183. This is reverse type of strategies.
// The strategy buys at market, if close price is higher than the previous close 
// during 2 days and the meaning of 9-days Stochastic Slow Oscillator is lower than 50. 
// The strategy sells at market, if close price is lower than the previous close price 
// during 2 days and the meaning of 9-days Stochastic Fast Oscillator is higher than 50.
//
// Second strategy
// This indicator gauges the magnitude of price and volume movement. 
// The indicator returns both positive and negative values where a 
// positive value means the market has moved up from yesterday's value 
// and a negative value means the market has moved down. A large positive 
// or large negative value indicates a large move in price and/or lighter 
// volume. A small positive or small negative value indicates a small move 
// in price and/or heavier volume.
// A positive or negative numeric value. A positive value means the market 
// has moved up from yesterday's value, whereas, a negative value means the 
// market has moved down. 
//
// WARNING:
// - For purpose educate only
// - This script to change bars colors.
////////////////////////////////////////////////////////////
Reversal123(Length, KSmoothing, DLength, Level) =>
    vFast = sma(stoch(close, high, low, Length), KSmoothing) 
    vSlow = sma(vFast, DLength)
    pos = 0.0
    pos := iff(close[2] < close[1] and close > close[1] and vFast < vSlow and vFast > Level, 1,
	         iff(close[2] > close[1] and close < close[1] and vFast > vSlow and vFast < Level, -1, nz(pos[1], 0))) 
	pos

EOM(BuyZone, SellZone) =>
    pos = 0
    xHigh = high
    xLow = low
    xVolume = volume
    xHalfRange = (xHigh - xLow) * 0.5
    xMidpointMove = mom(xHalfRange, 1)
    xBoxRatio = iff((xHigh - xLow) != 0, xVolume / (xHigh - xLow), 0)
    nRes = iff(xBoxRatio != 0, 1000000 * ((xMidpointMove - xMidpointMove[1]) / xBoxRatio), 0)
    pos := iff(nRes > BuyZone, 1,
             iff(nRes < SellZone, -1, nz(pos[1], 0))) 
    pos

strategy(title="Combo Backtest 123 Reversal & Ease of Movement (EOM)", shorttitle="Combo", overlay = true)
Length = input(14, minval=1)
KSmoothing = input(1, minval=1)
DLength = input(3, minval=1)
Level = input(50, minval=1)
//-------------------------
BuyZone = input(4000, minval=1)
SellZone = input(-4000)
reverse = input(false, title="Trade reverse")
posReversal123 = Reversal123(Length, KSmoothing, DLength, Level)
posEOM = EOM(BuyZone, SellZone)
pos = iff(posReversal123 == 1 and posEOM == 1 , 1,
	   iff(posReversal123 == -1 and posEOM == -1, -1, 0)) 
possig = iff(reverse and pos == 1, -1,
          iff(reverse and pos == -1 , 1, pos))	   
if (possig == 1) 
    strategy.entry("Long", strategy.long)
if (possig == -1)
    strategy.entry("Short", strategy.short)	 
if (possig == 0) 
    strategy.close_all()
barcolor(possig == -1 ? #b50404: possig == 1 ? #079605 : #0536b3 )

More