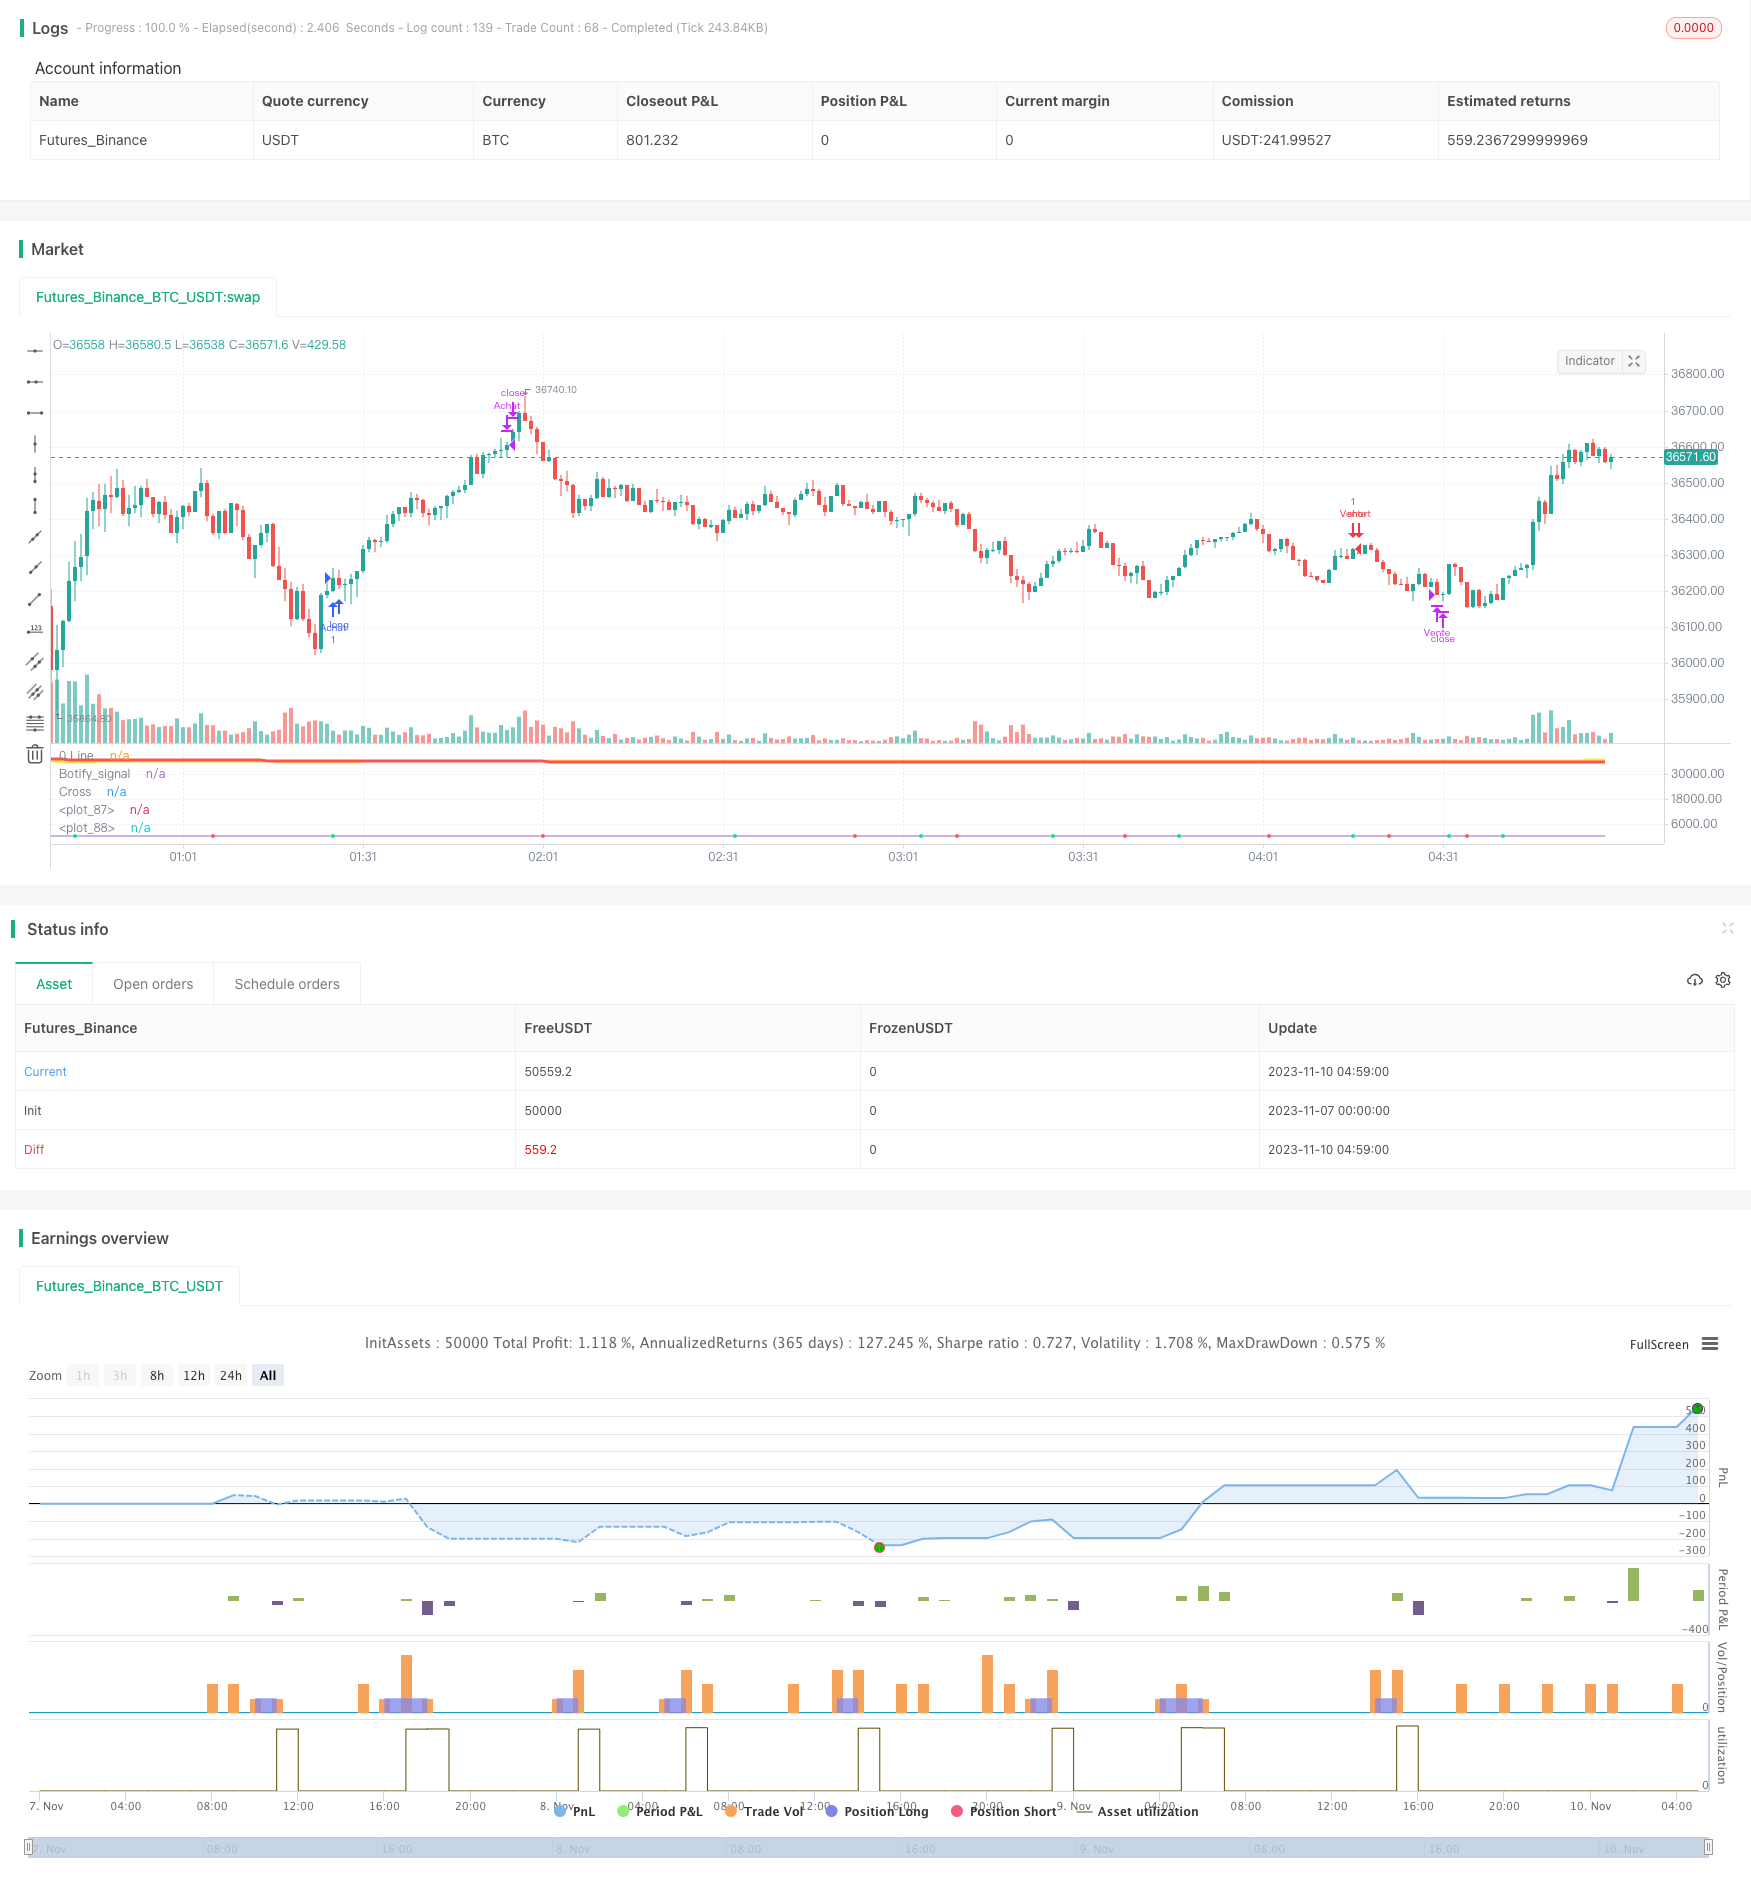
概述
该策略结合了均线和MACD指标来判断趋势和发出交易信号,属于典型的趋势跟踪策略。它使用两个不同周期的ZLSMA均线进行判断趋势方向,再结合MACD指标的多空线交叉来发出具体的买入和卖出信号,可以有效捕捉中长线趋势的同时避免被短期市场噪音所误导。
策略原理
该策略主要由以下几部分组成:
快速ZLSMA均线和慢速ZLSMA均线:通过不同周期的ZLSMA均线比较,判断总体趋势方向。快速线由32周期ZLSMA组成,慢速线由400周期ZLSMA组成。当快速线上穿慢速线时为看多形态,反之则看空。
MACD指标:由快线(12日EMA)减去慢线(26日EMA)得到差离值MACD,再用9日EMA得到信号线。当MACD上穿信号线时为买入信号,下穿为卖出信号。
交易信号:只有当ZLSMA形态和MACD信号同向时,才会发出买入或卖出信号。即多头趋势加上MACD金叉时买入,空头趋势加上MACD死叉时卖出。
止损止盈:该策略暂未加入止损止盈逻辑,需要后续进一步优化。
以上组合使用均线判断大趋势,MACD判断入场时机,可以有效过滤假突破,避免被短期市场噪音误导。
优势分析
该策略主要有以下优势:
捕捉趋势:通过不同周期均线组合判断趋势方向,可以顺势而为,有效捕捉中长线趋势。
过滤噪音:MACD指标的应用可以过滤短期市场噪音,避免被小范围震荡误导。
参数可调:均线周期和MACD参数都可以自定义,可以针对不同市场进行优化。
易于实施:各项指标均为常用技术指标,组合逻辑简单清晰,易于理解和实施。
风险可控:有明确的止损和止盈策略,可以控制每笔交易的风险和收益比。
风险分析
该策略也存在以下风险:
大趋势判断错误:如果判断大趋势方向错误,则所有交易均可能失利。
参数优化不当:必须要对均线参数和MACD参数进行详细测试和优化,否则效果可能不佳。
缺乏止损机制:目前没有设置止损点,存在亏损过大的风险。
盈利空间有限:作为趋势跟踪策略,每个交易盈利空间有限,需要数量来获得更高收益。
交易频率过高:参数设置不当可能导致交易频率过高,增加交易成本和滑点成本。
优化方向
该策略可以从以下几个方面进行进一步优化:
加入止损机制:设置合理的止损点,严格控制单笔交易的最大亏损。
优化参数:通过回测和优化找到最佳的均线和MACD参数组合。
降低交易频率:调整参数,确保只在趋势较明显时才发出交易信号。
结合其他因素:可加入交易量变化等其他因素来确认趋势和信号。
优化入场时机:进一步优化MACD指标的应用,提高入场的准确性。
多品种通用:通过参数优化,使策略可以广泛适用于不同品种,扩大适用范围。
总结
整体来说,该策略通过简单有效的均线和MACD指标组合,实现了对中长线趋势的捕捉,可以作为量化交易的基础策略。但仍需要进一步优化参数,控制风险,并结合其他因素来实现更稳定的交易效果。具有一定的实战价值和拓展空间。
/*backtest
start: 2023-11-07 00:00:00
end: 2023-11-10 05:00:00
period: 1m
basePeriod: 1m
exchanges: [{"eid":"Futures_Binance","currency":"BTC_USDT"}]
*/

// This source code is subject to the terms of the Mozilla Public License 2.0 at https://mozilla.org/MPL/2.0/
// © veryfid

//@version=5
strategy("Stratégie ZLSMA Bruno", shorttitle="Stratégie ZLSMA Bruno", overlay=false)

source = close
useCurrentRes = input(true, title="Use Current Chart Resolution?")
smd = input(true, title="Show MacD & Signal Line? Also Turn Off Dots Below")
sd = input(true, title="Show Dots When MacD Crosses Signal Line?")
sh = input(true, title="Show Histogram?")
macd_colorChange = input(true,title="Change MacD Line Color-Signal Line Cross?")
hist_colorChange = input(true,title="MacD Histogram 4 Colors?")

//res = useCurrentRes ? period : resCustom

fastLength = input(12),
slowLength=input(26)
signalLength=input(9)

fastMA = ta.ema(source, fastLength)
slowMA = ta.ema(source, slowLength)

macd = fastMA - slowMA
signal = ta.sma(macd, signalLength)
hist = macd - signal

outMacD =  macd
outSignal = signal
outHist =  hist

histA_IsUp = outHist > outHist[1] and outHist > 0
histA_IsDown = outHist < outHist[1] and outHist > 0
histB_IsDown = outHist < outHist[1] and outHist <= 0
histB_IsUp = outHist > outHist[1] and outHist <= 0

//MacD Color Definitions
macd_IsAbove = outMacD >= outSignal
macd_IsBelow = outMacD < outSignal

//plot_color = hist_colorChange ? histA_IsUp ? aqua : histA_IsDown ? blue : histB_IsDown ? red : histB_IsUp ? maroon :yellow :gray
macd_color = macd_colorChange ? macd_IsAbove ? color.lime : color.red : color.red
//signal_color = macd_colorChange ? macd_IsAbove ? yellow : yellow : lime

circleYPosition = outSignal

//plot(smd and outMacD ? outMacD : na, title="MACD", color=macd_color, linewidth=4)
//plot(smd and outSignal ? outSignal : na, title="Signal Line", color=signal_color, style=line ,linewidth=2)
//plot(sh and outHist ? outHist : na, title="Histogram", color=plot_color, style=histogram, linewidth=4)
plot(sd and ta.cross(outMacD, outSignal) ? circleYPosition : na, title="Cross", style=plot.style_circles, linewidth=4, color=macd_color)
hline(0, '0 Line', linestyle=hline.style_solid, linewidth=2, color=color.white)

// Paramètres de la ZLSMA
length = input(32, title="Longueur")
offset = input(0, title="Décalage")
src = input(close, title="Source")
lsma = ta.linreg(src, length, offset)
lsma2 = ta.linreg(lsma, length, offset)
eq = lsma - lsma2
zlsma = lsma + eq

length_slow = input(400, title="Longueur")
offset_slow = input(0, title="Décalage")
lsma_slow = ta.linreg(src, length_slow, offset_slow)
lsma2_slow = ta.linreg(lsma_slow, length_slow, offset_slow)
eq_slow = lsma_slow - lsma2_slow
zlsma_slow = lsma_slow + eq_slow

// Paramètres de la sensibilité
sensitivity = input(0.5, title="Sensibilité")

// Règles de trading
longCondition = zlsma < zlsma_slow and  zlsma_slow < zlsma_slow[1] and zlsma > zlsma[1] and ta.cross(outMacD, outSignal) and  macd_color == color.lime//ta.crossover(zlsma, close) and ta.crossover(zlsma, zlsma[1]) // Croisement vers le haut
shortCondition = zlsma > zlsma_slow and  zlsma_slow > zlsma_slow[1] and zlsma < zlsma[1] and ta.cross(outMacD, outSignal) and  macd_color == color.lime   //ta.crossunder(zlsma, close) and ta.crossunder(zlsma, zlsma[1]) // Croisement vers le bas

// Entrée en position
strategy.entry("Achat", strategy.long, when=longCondition)
strategy.entry("Vente", strategy.short, when=shortCondition)
botifySignalZLSMA = longCondition ? 1 : shortCondition ? -1 : 0
plot(botifySignalZLSMA, title='Botify_signal', display=display.none)
// Sortie de position
strategy.close("Achat", when=ta.crossunder(zlsma, close)) // Close the "Achat" position
strategy.close("Vente", when=ta.crossover(zlsma, close)) // Close the "Vente" position


// Tracé de la courbe ZLSMA
plot(zlsma, color=color.yellow, linewidth=3)
plot(zlsma_slow, color=color.red, linewidth=3)